Grade 1 Ontario Worksheets
12 free printable sheets across 4 expectations, each written at up to three levels — Modified for reduced expectations, Standard for the expectation as written, and Challenge to extend beyond it — so one expectation covers the whole class. Every sheet includes a full answer key on the last page.
B2.4
3 worksheetsUse objects, diagrams, and equations to represent, describe, and solve situations involving addition and subtraction of whole numbers that add up to no more than 50
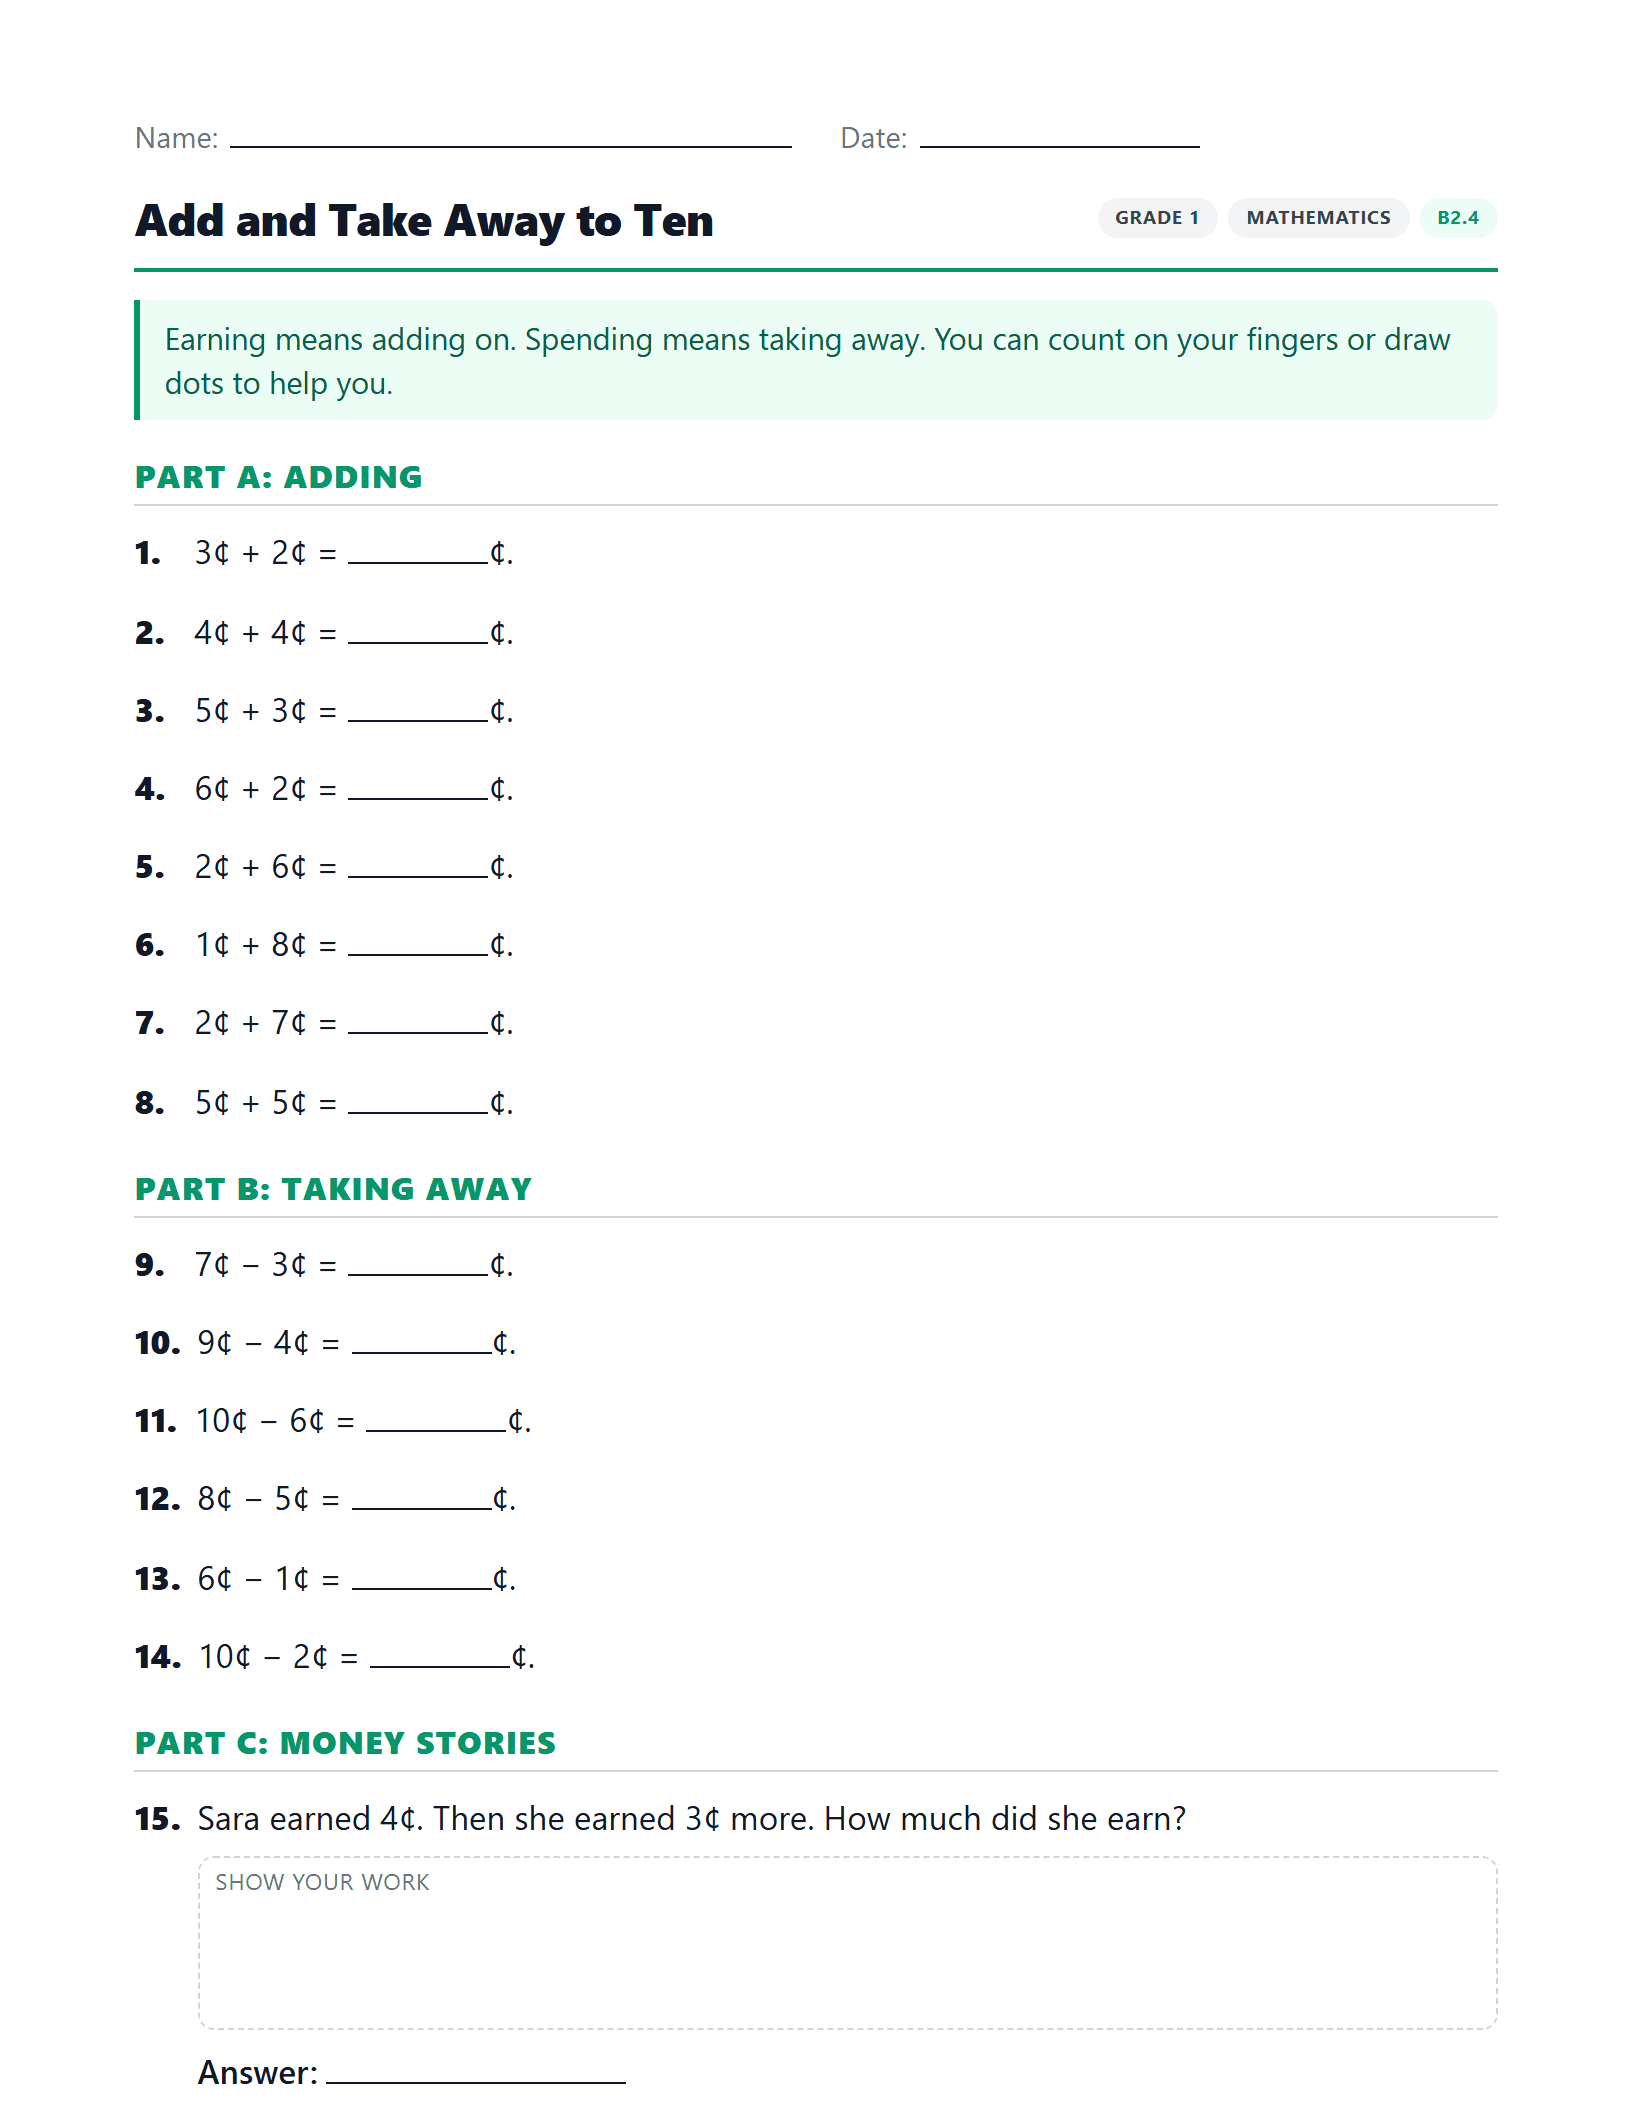
Add and Take Away to Ten
Add and take away cents up to ten, with drawings to help.
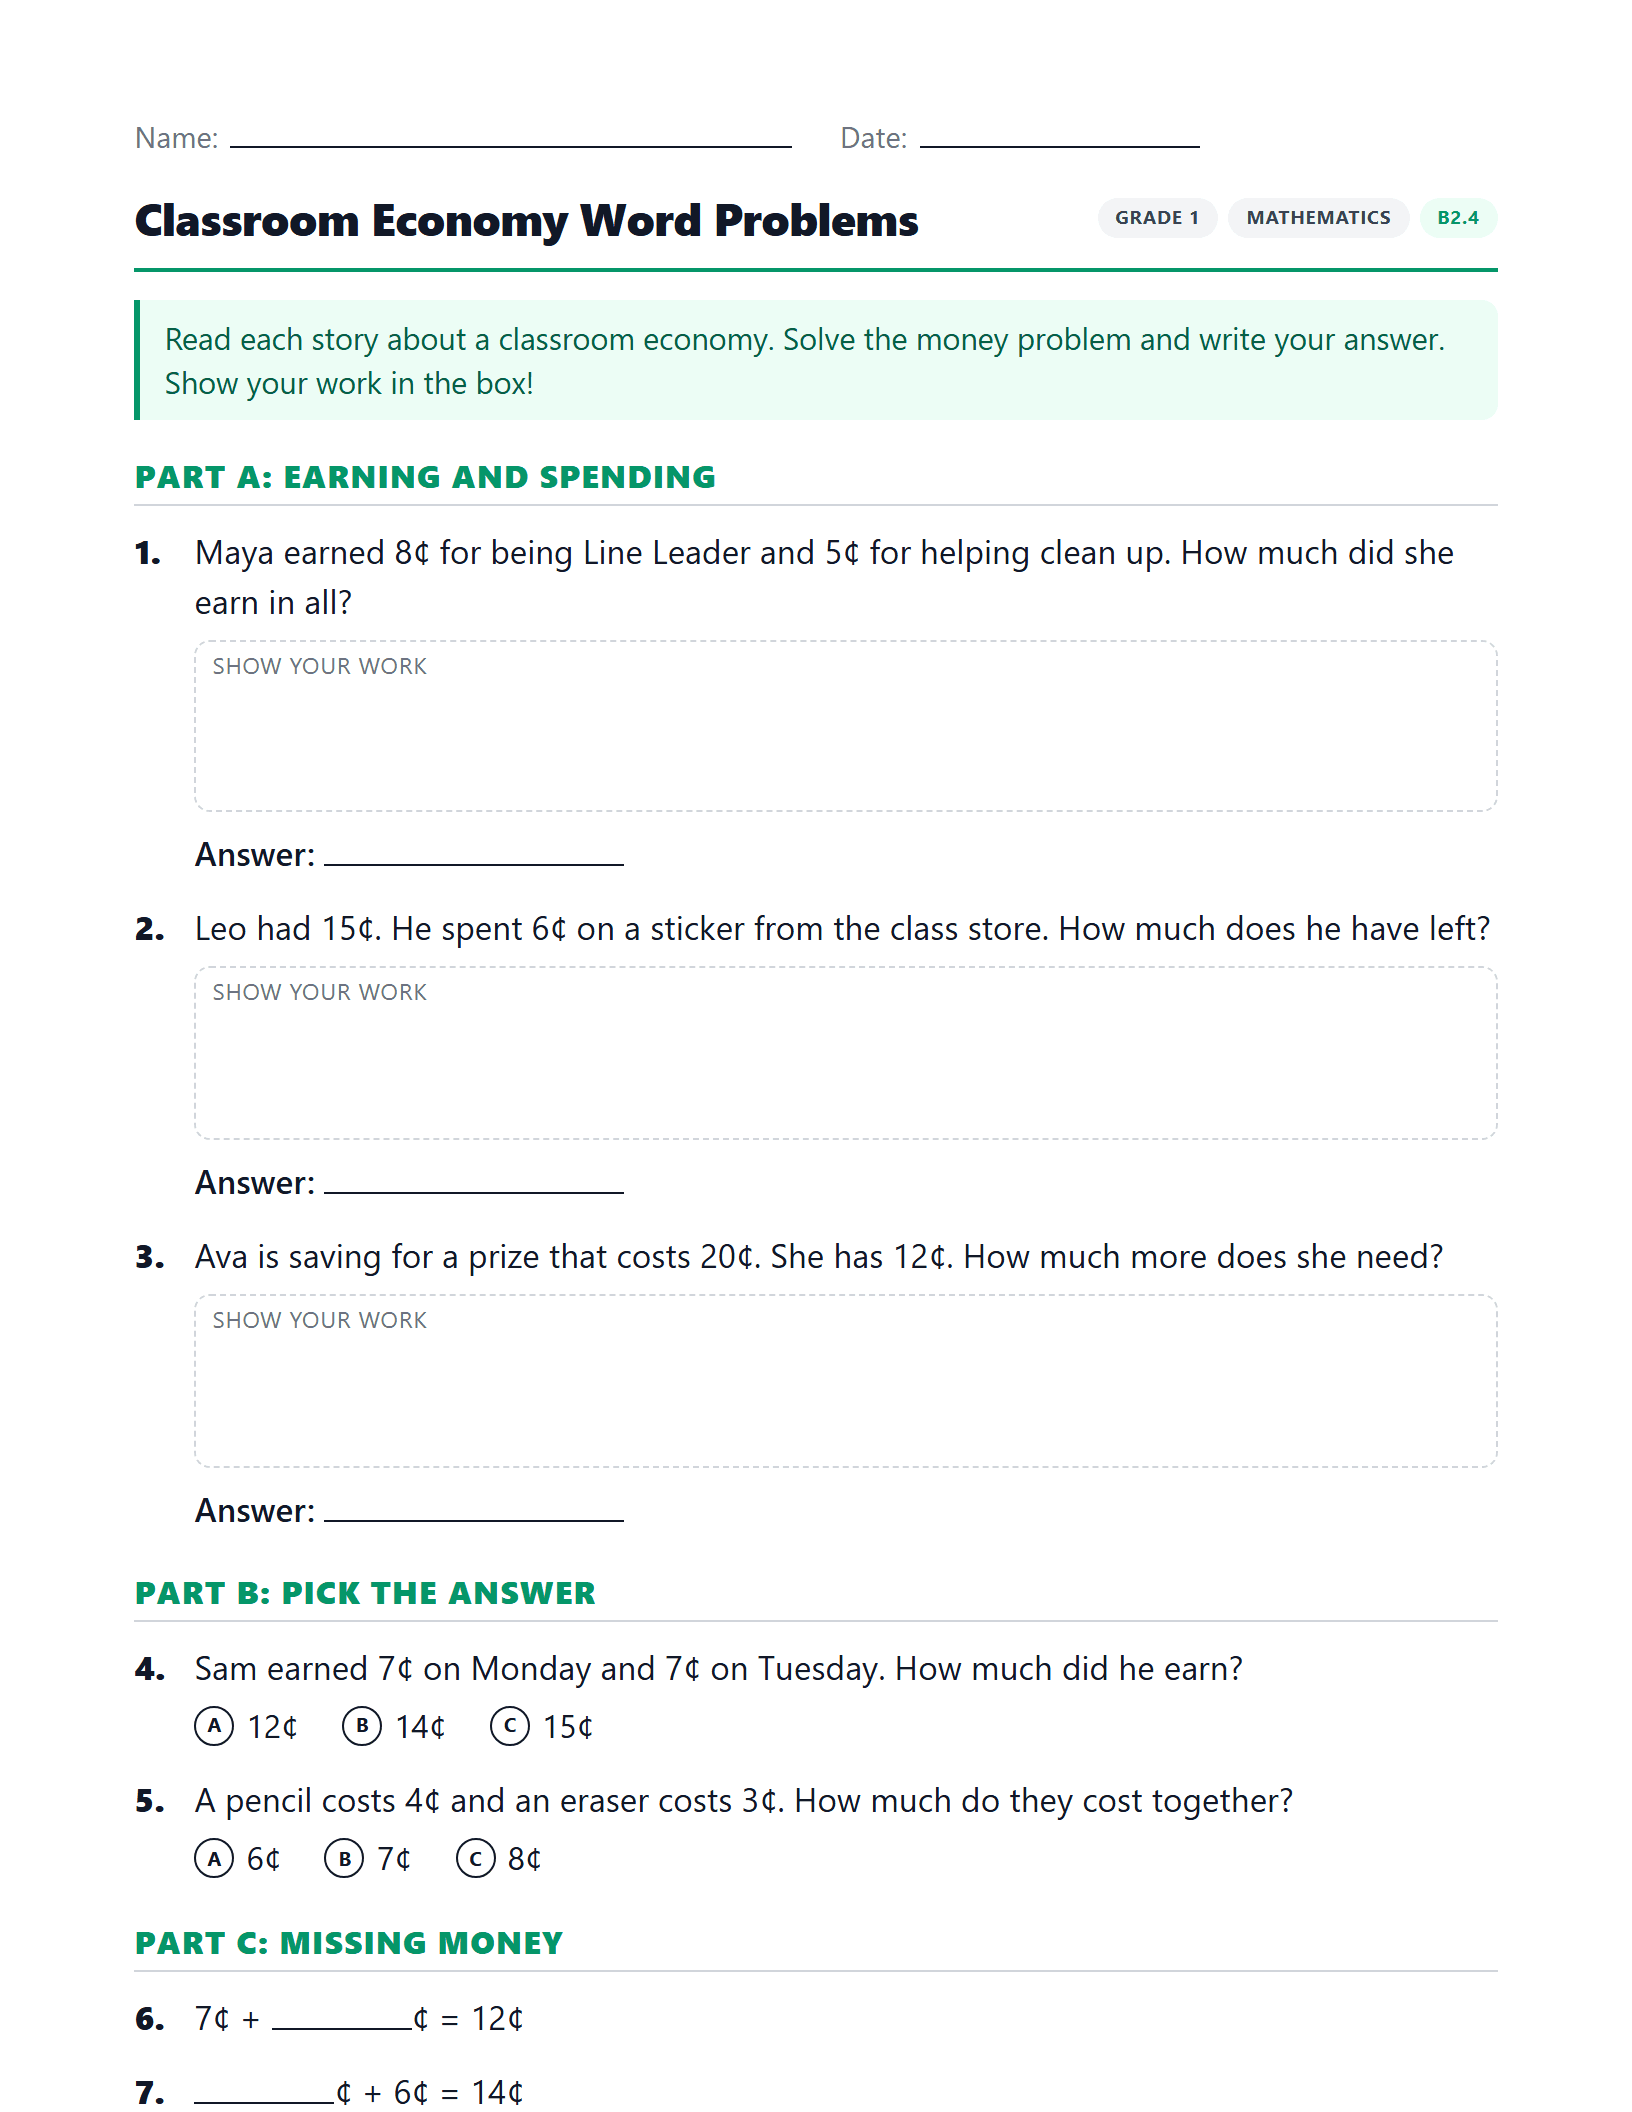
Classroom Economy Word Problems
Addition and subtraction money word problems (within 20 cents) set in a classroom economy.
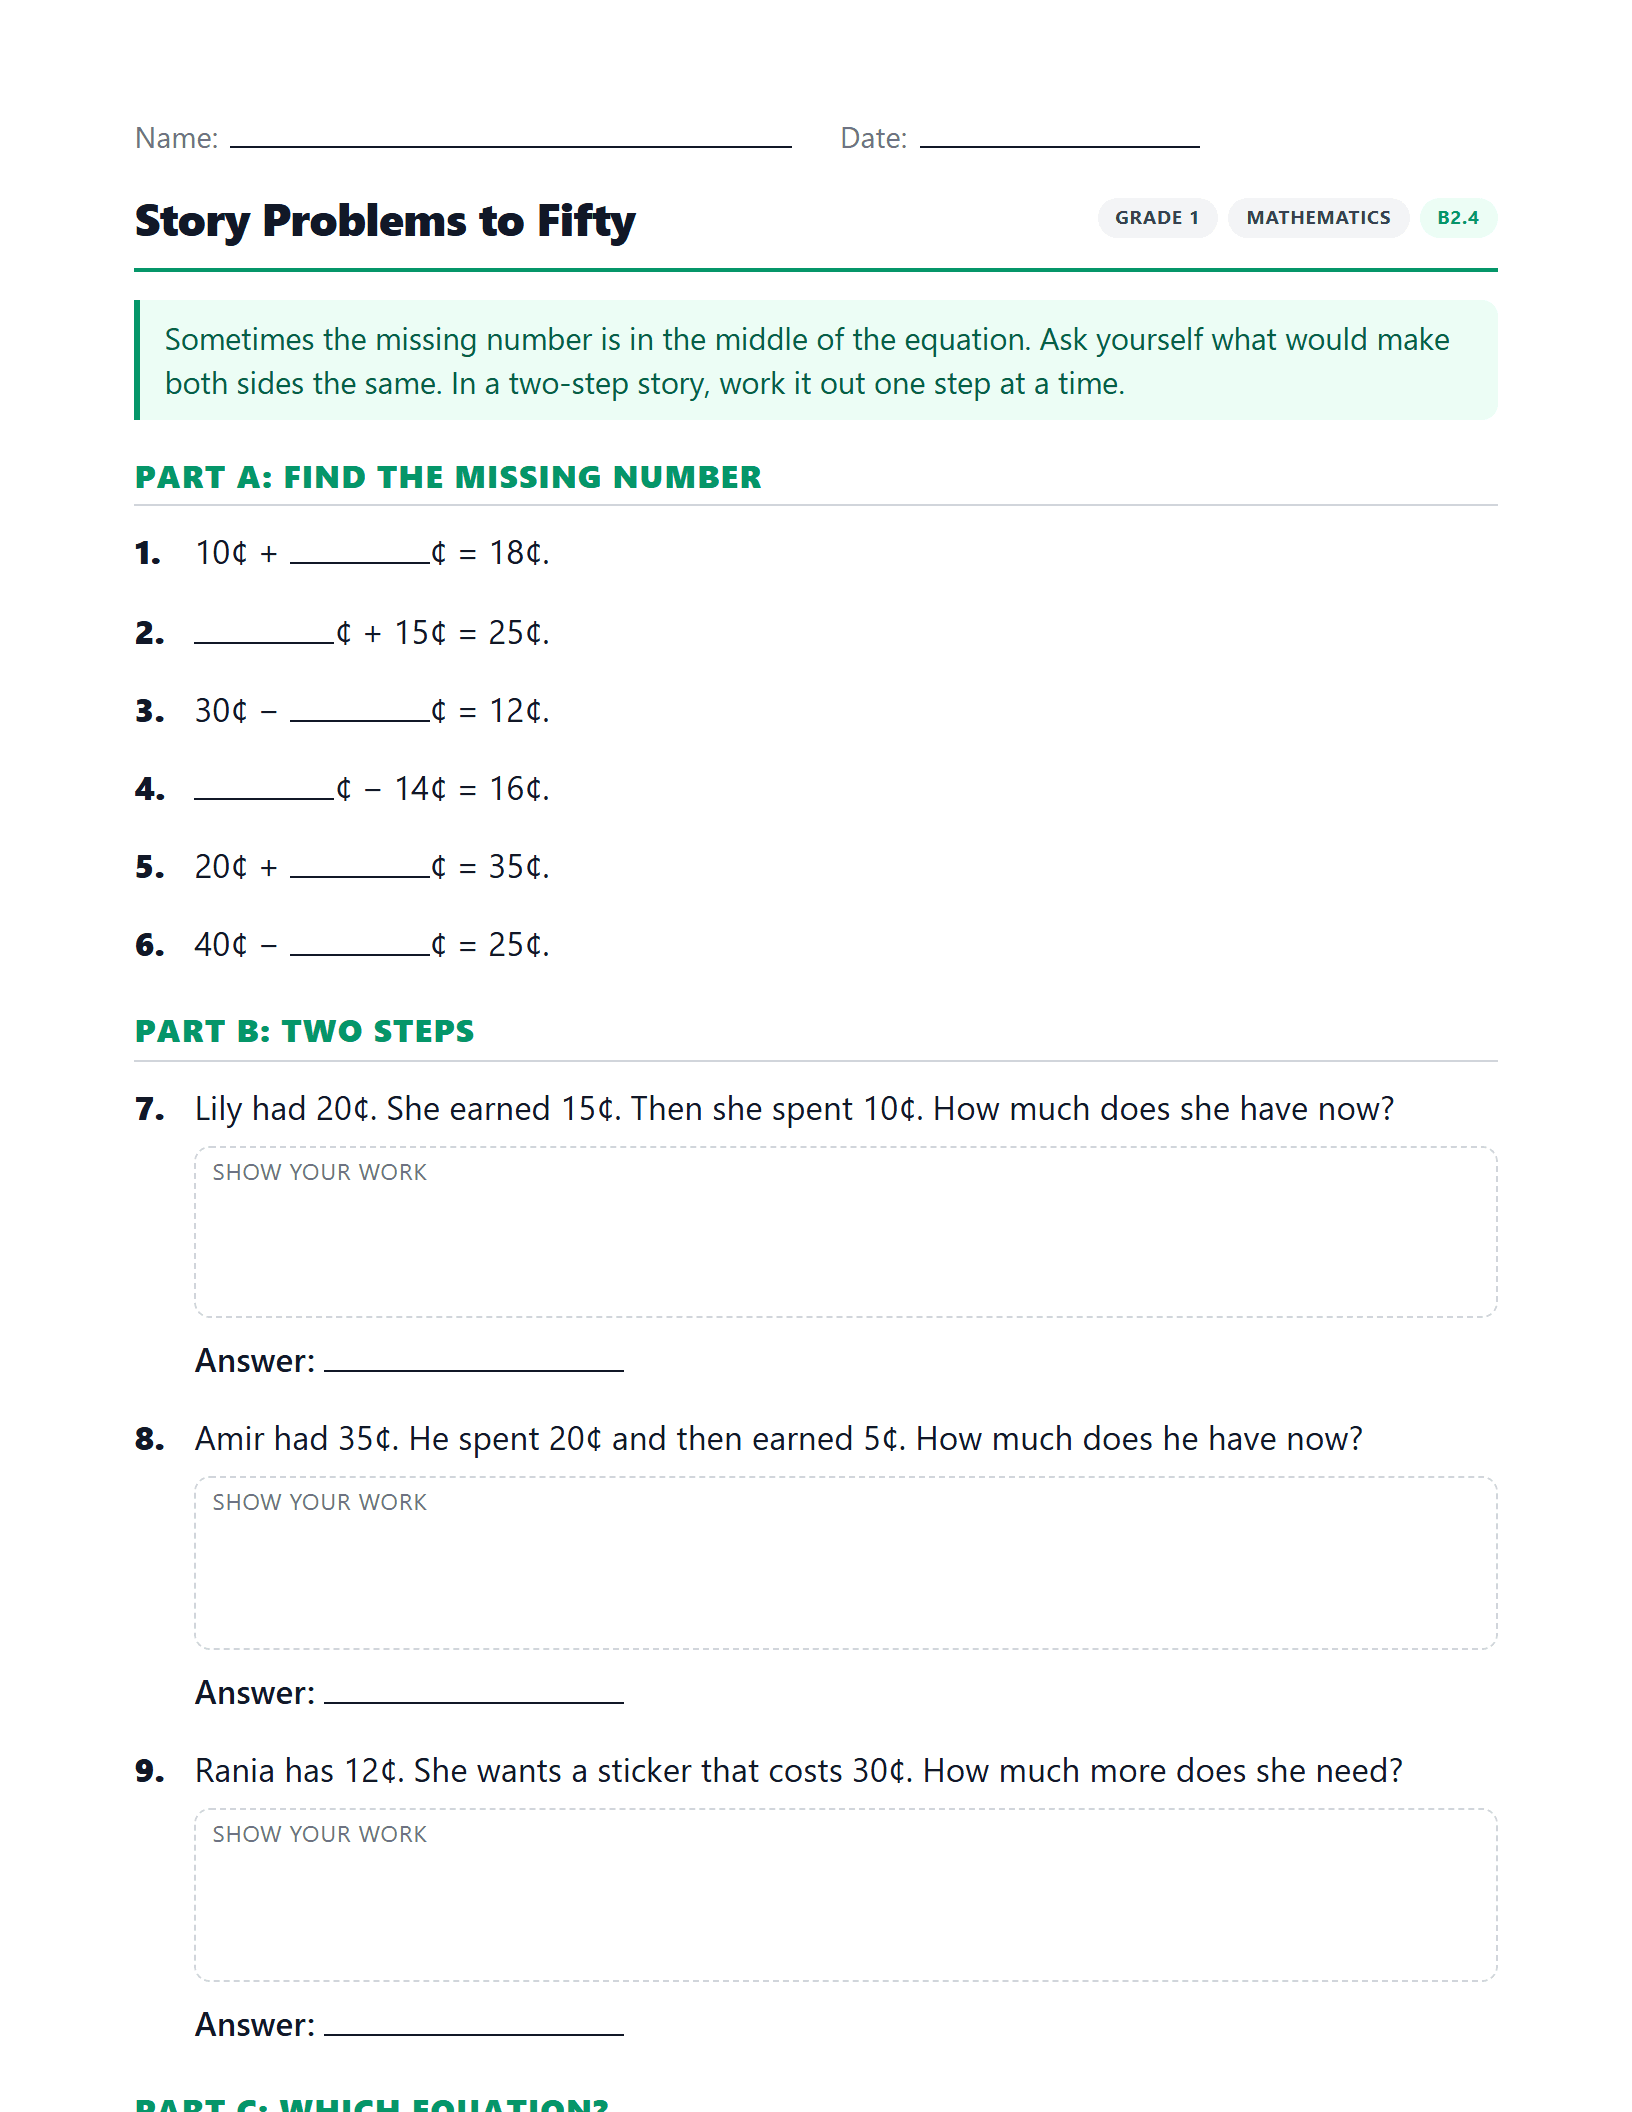
Story Problems to Fifty
Find a missing number in an equation, then solve money stories that have two steps.
F1.1
3 worksheetsIdentify the various Canadian coins up to 50¢ and coins and bills up to $50, and compare their values
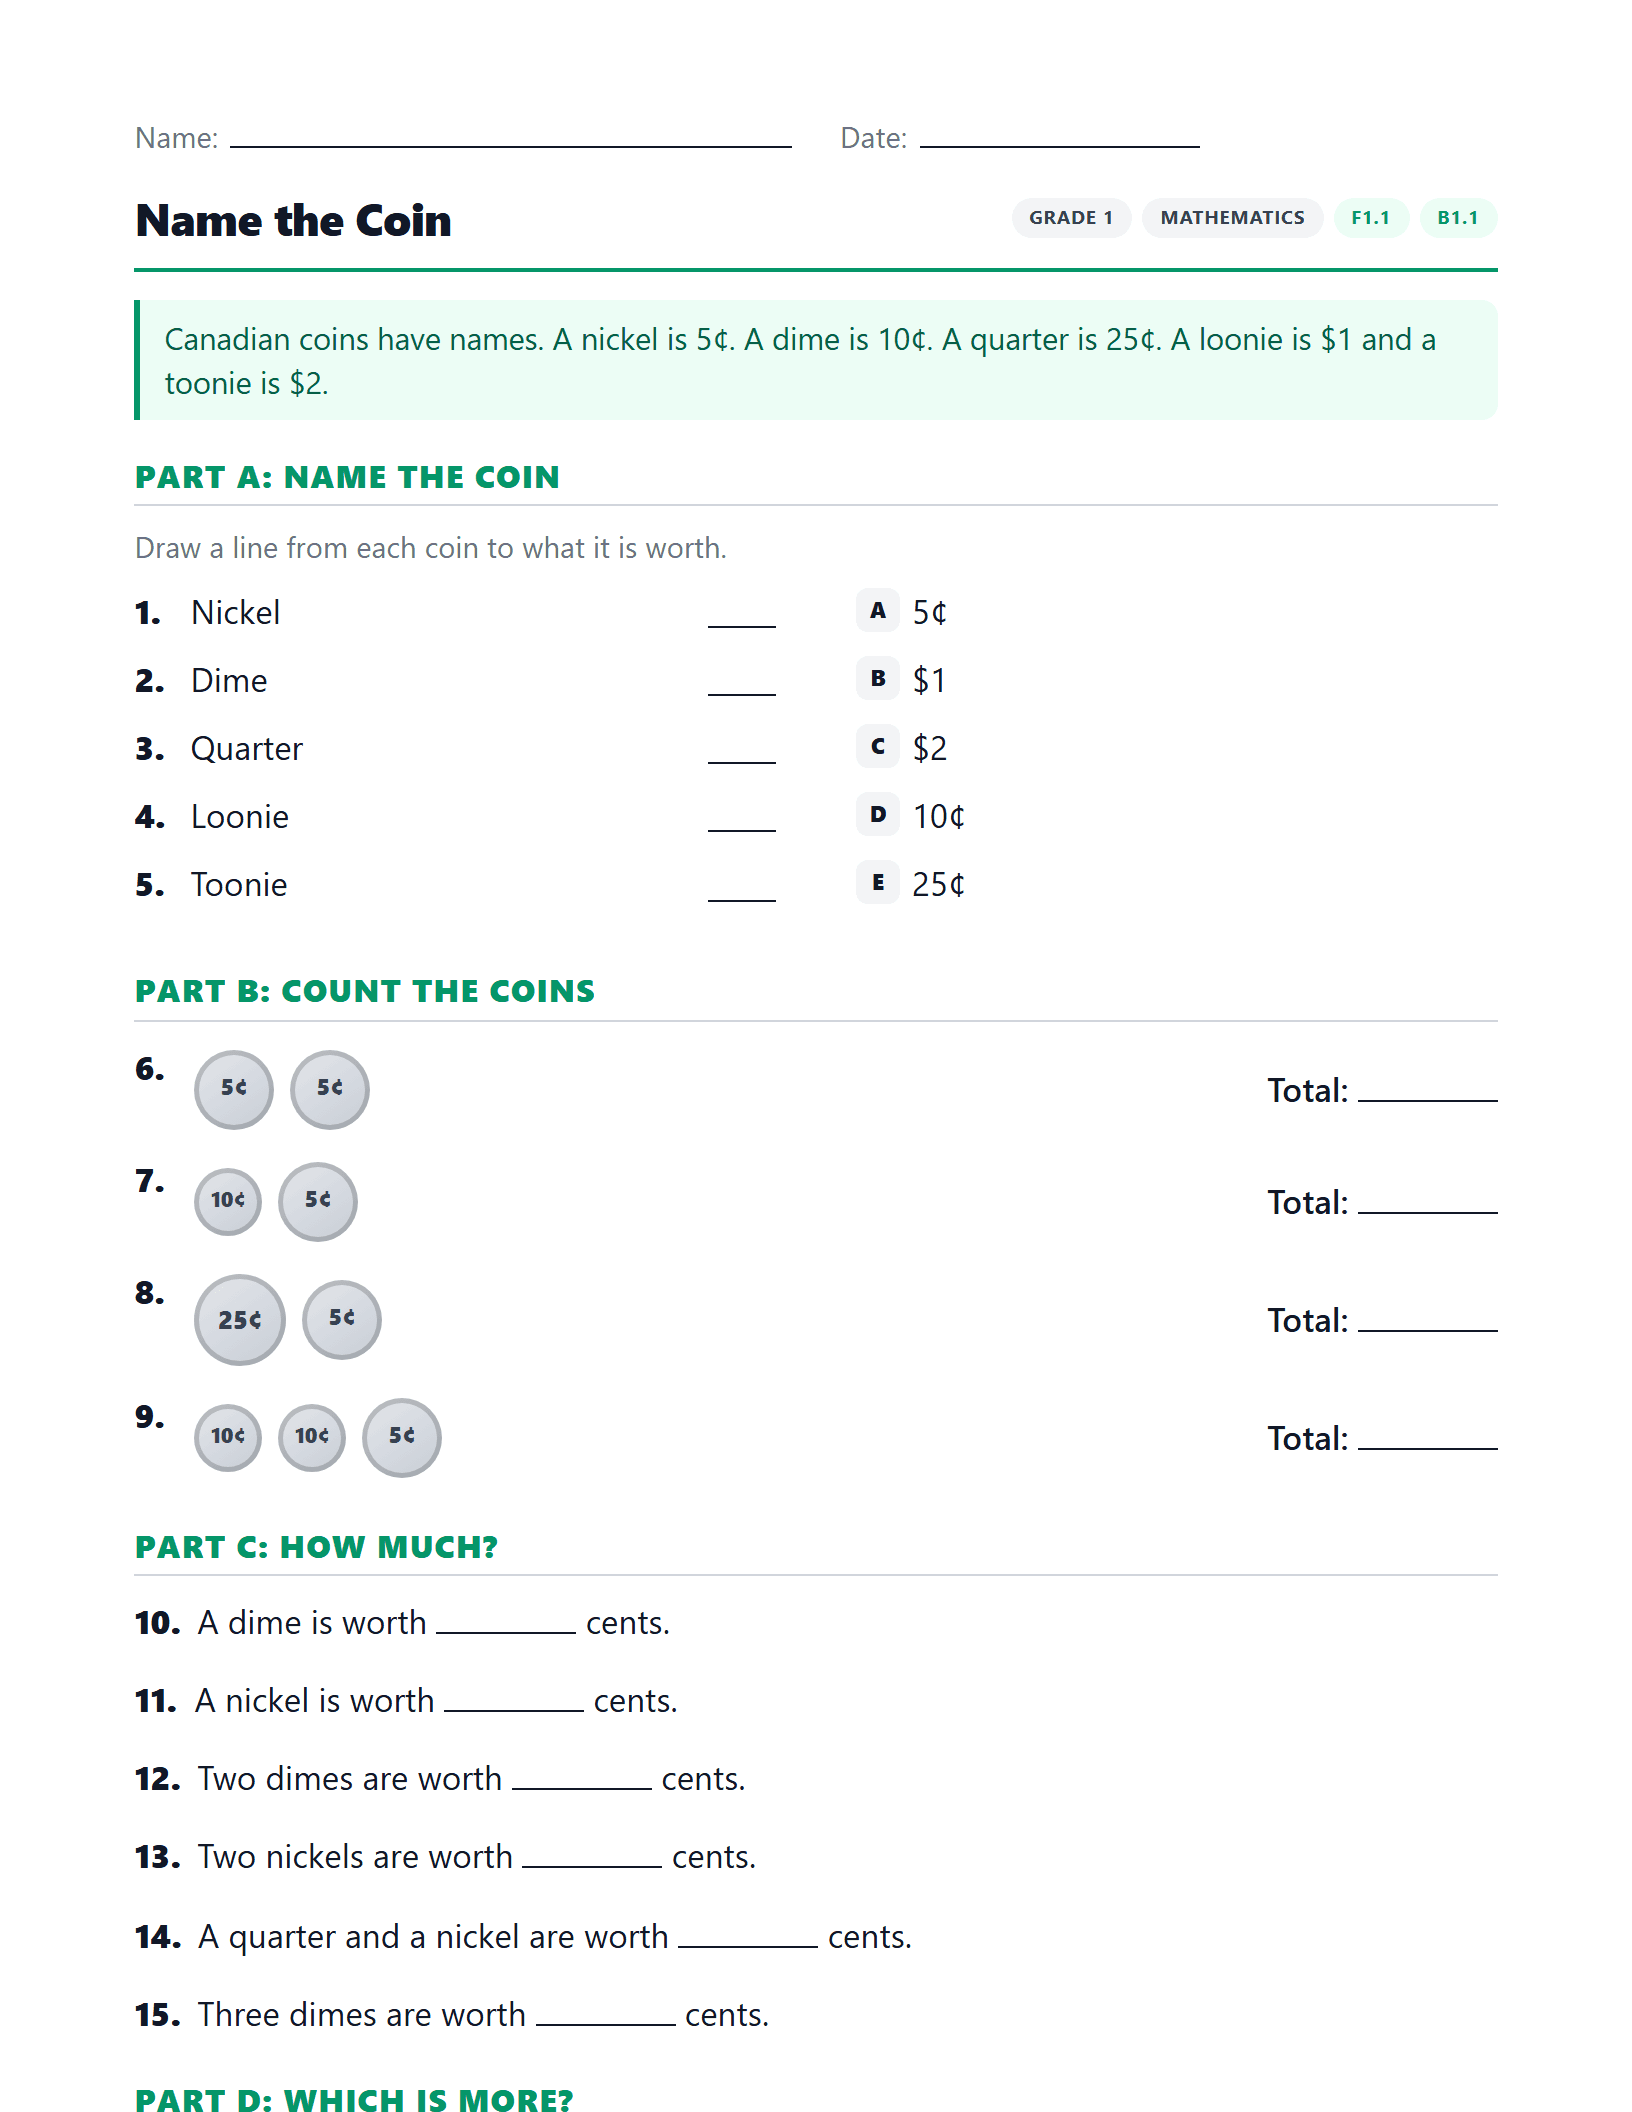
Name the Coin
Learn which coin is which, then count small groups of nickels, dimes and quarters.
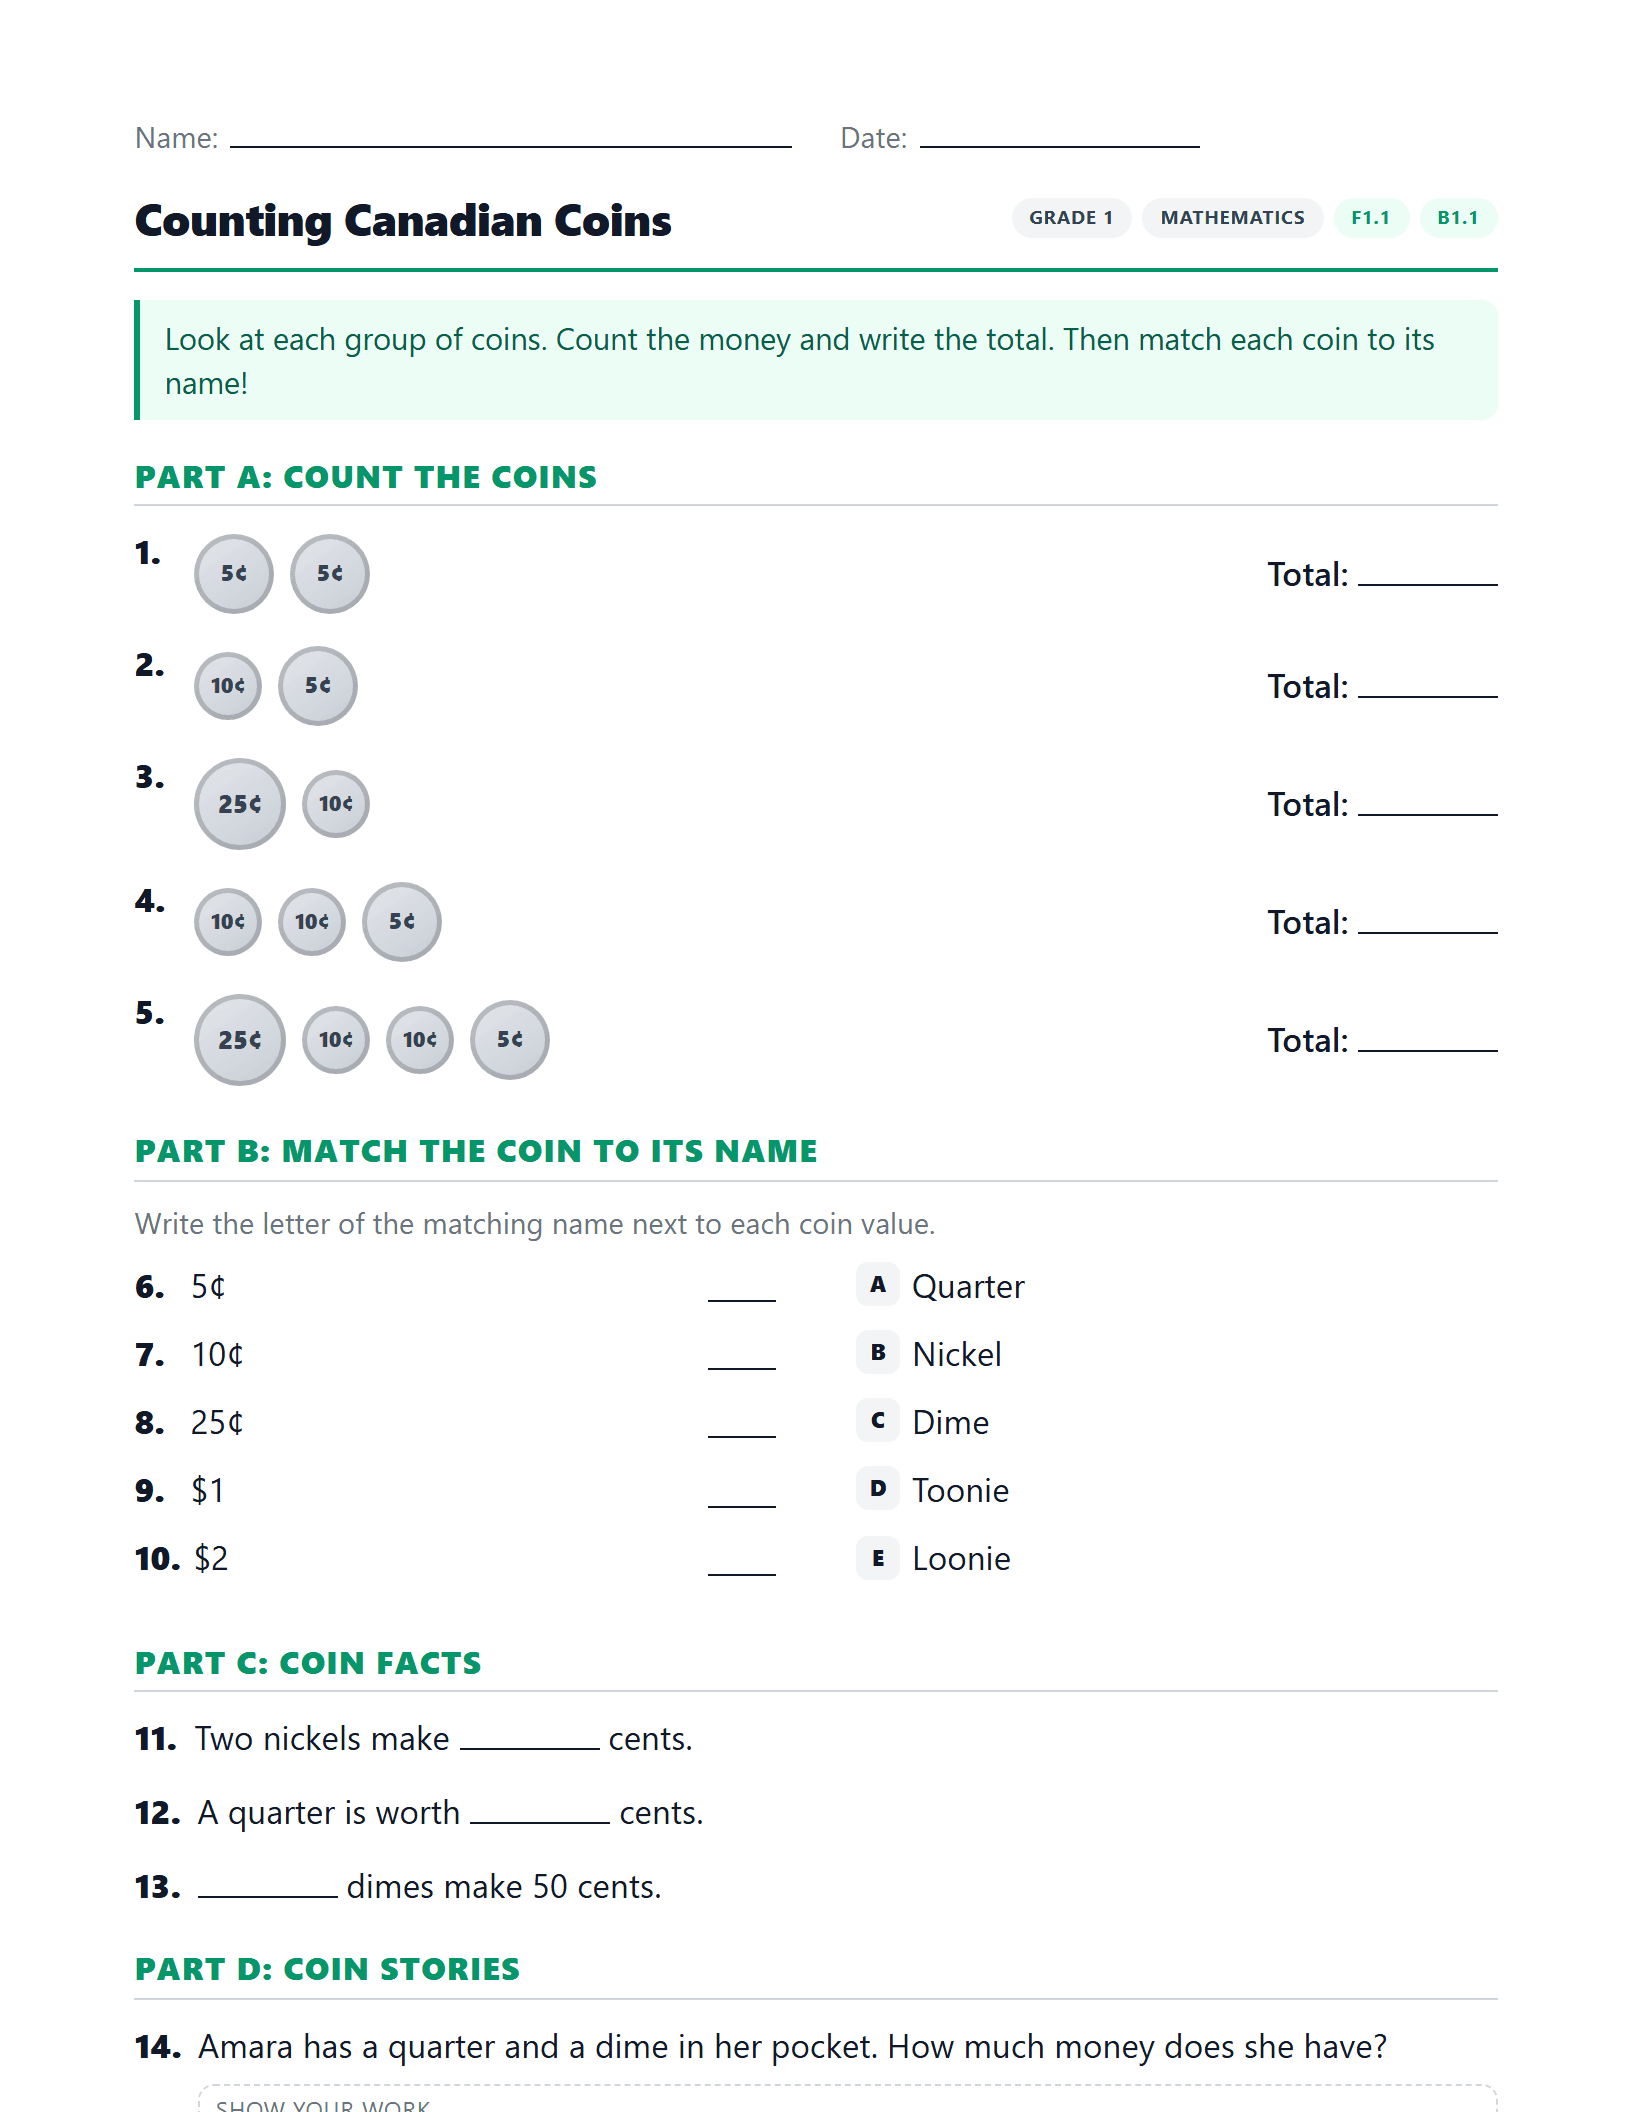
Counting Canadian Coins
Identify Canadian coins, compare what they are worth, count coin collections up to 50 cents, and solve coin story problems.
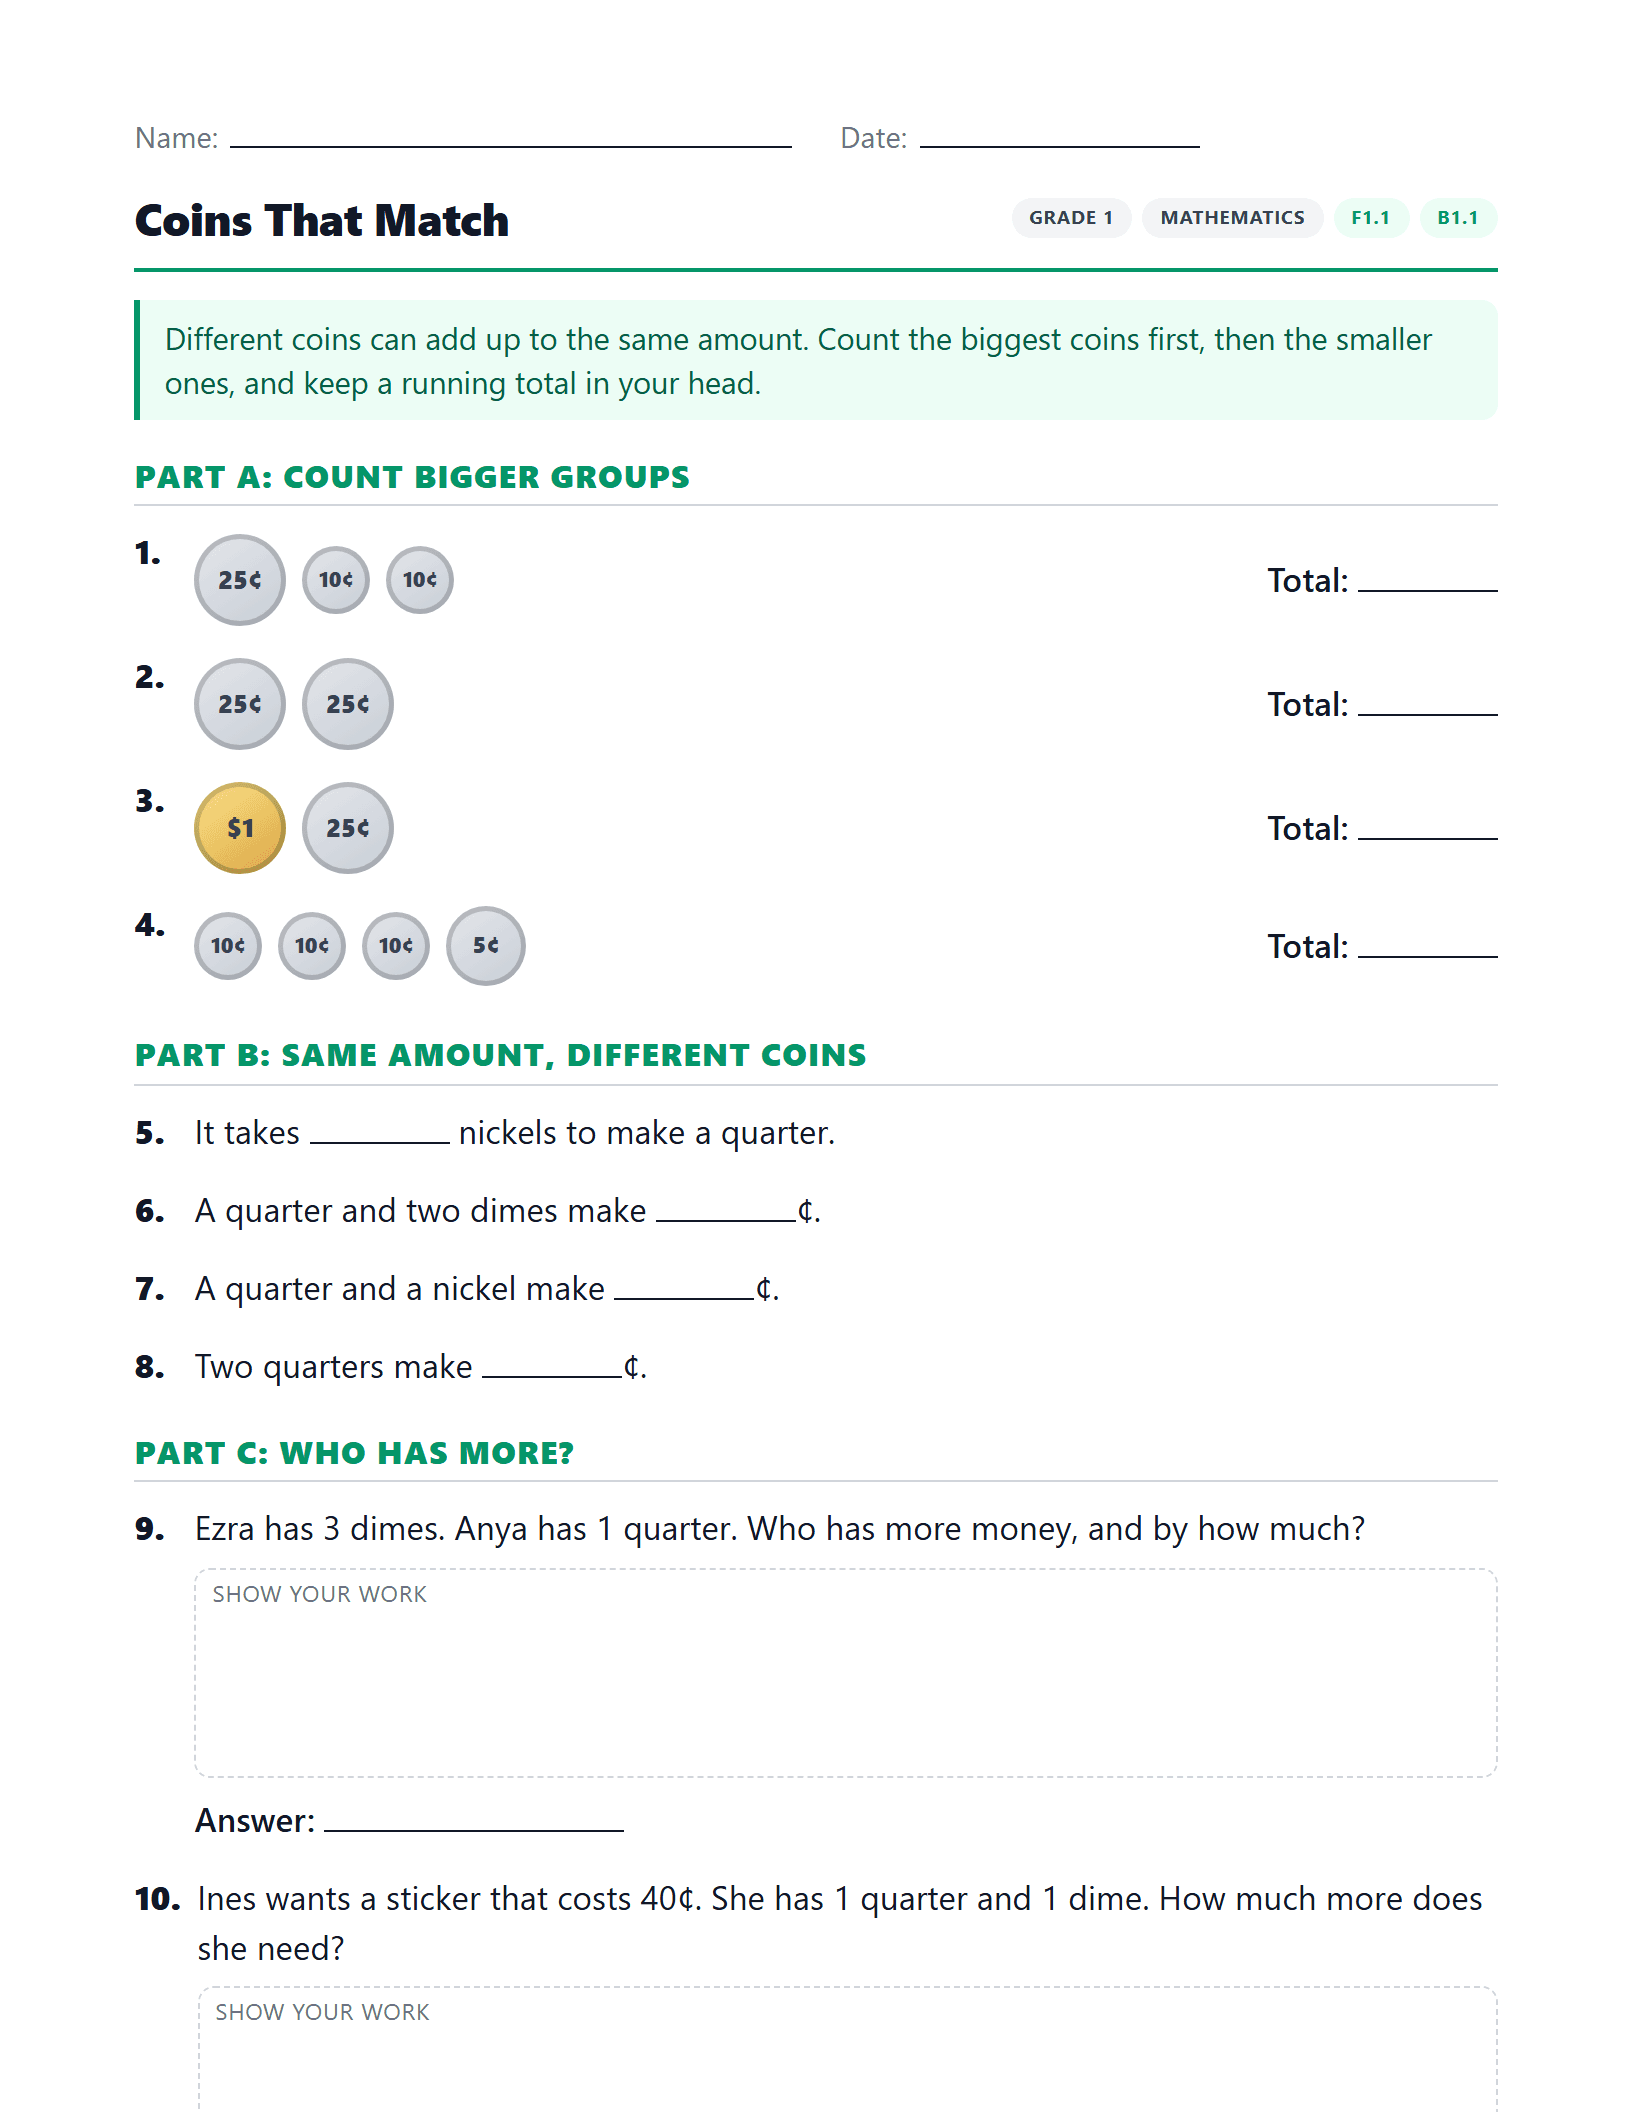
Coins That Match
Count mixed groups of coins, compare two sets, and find more than one way to make the same amount.
B1.1
3 worksheetsRead and represent whole numbers up to and including 50, and describe various ways they are used in everyday life
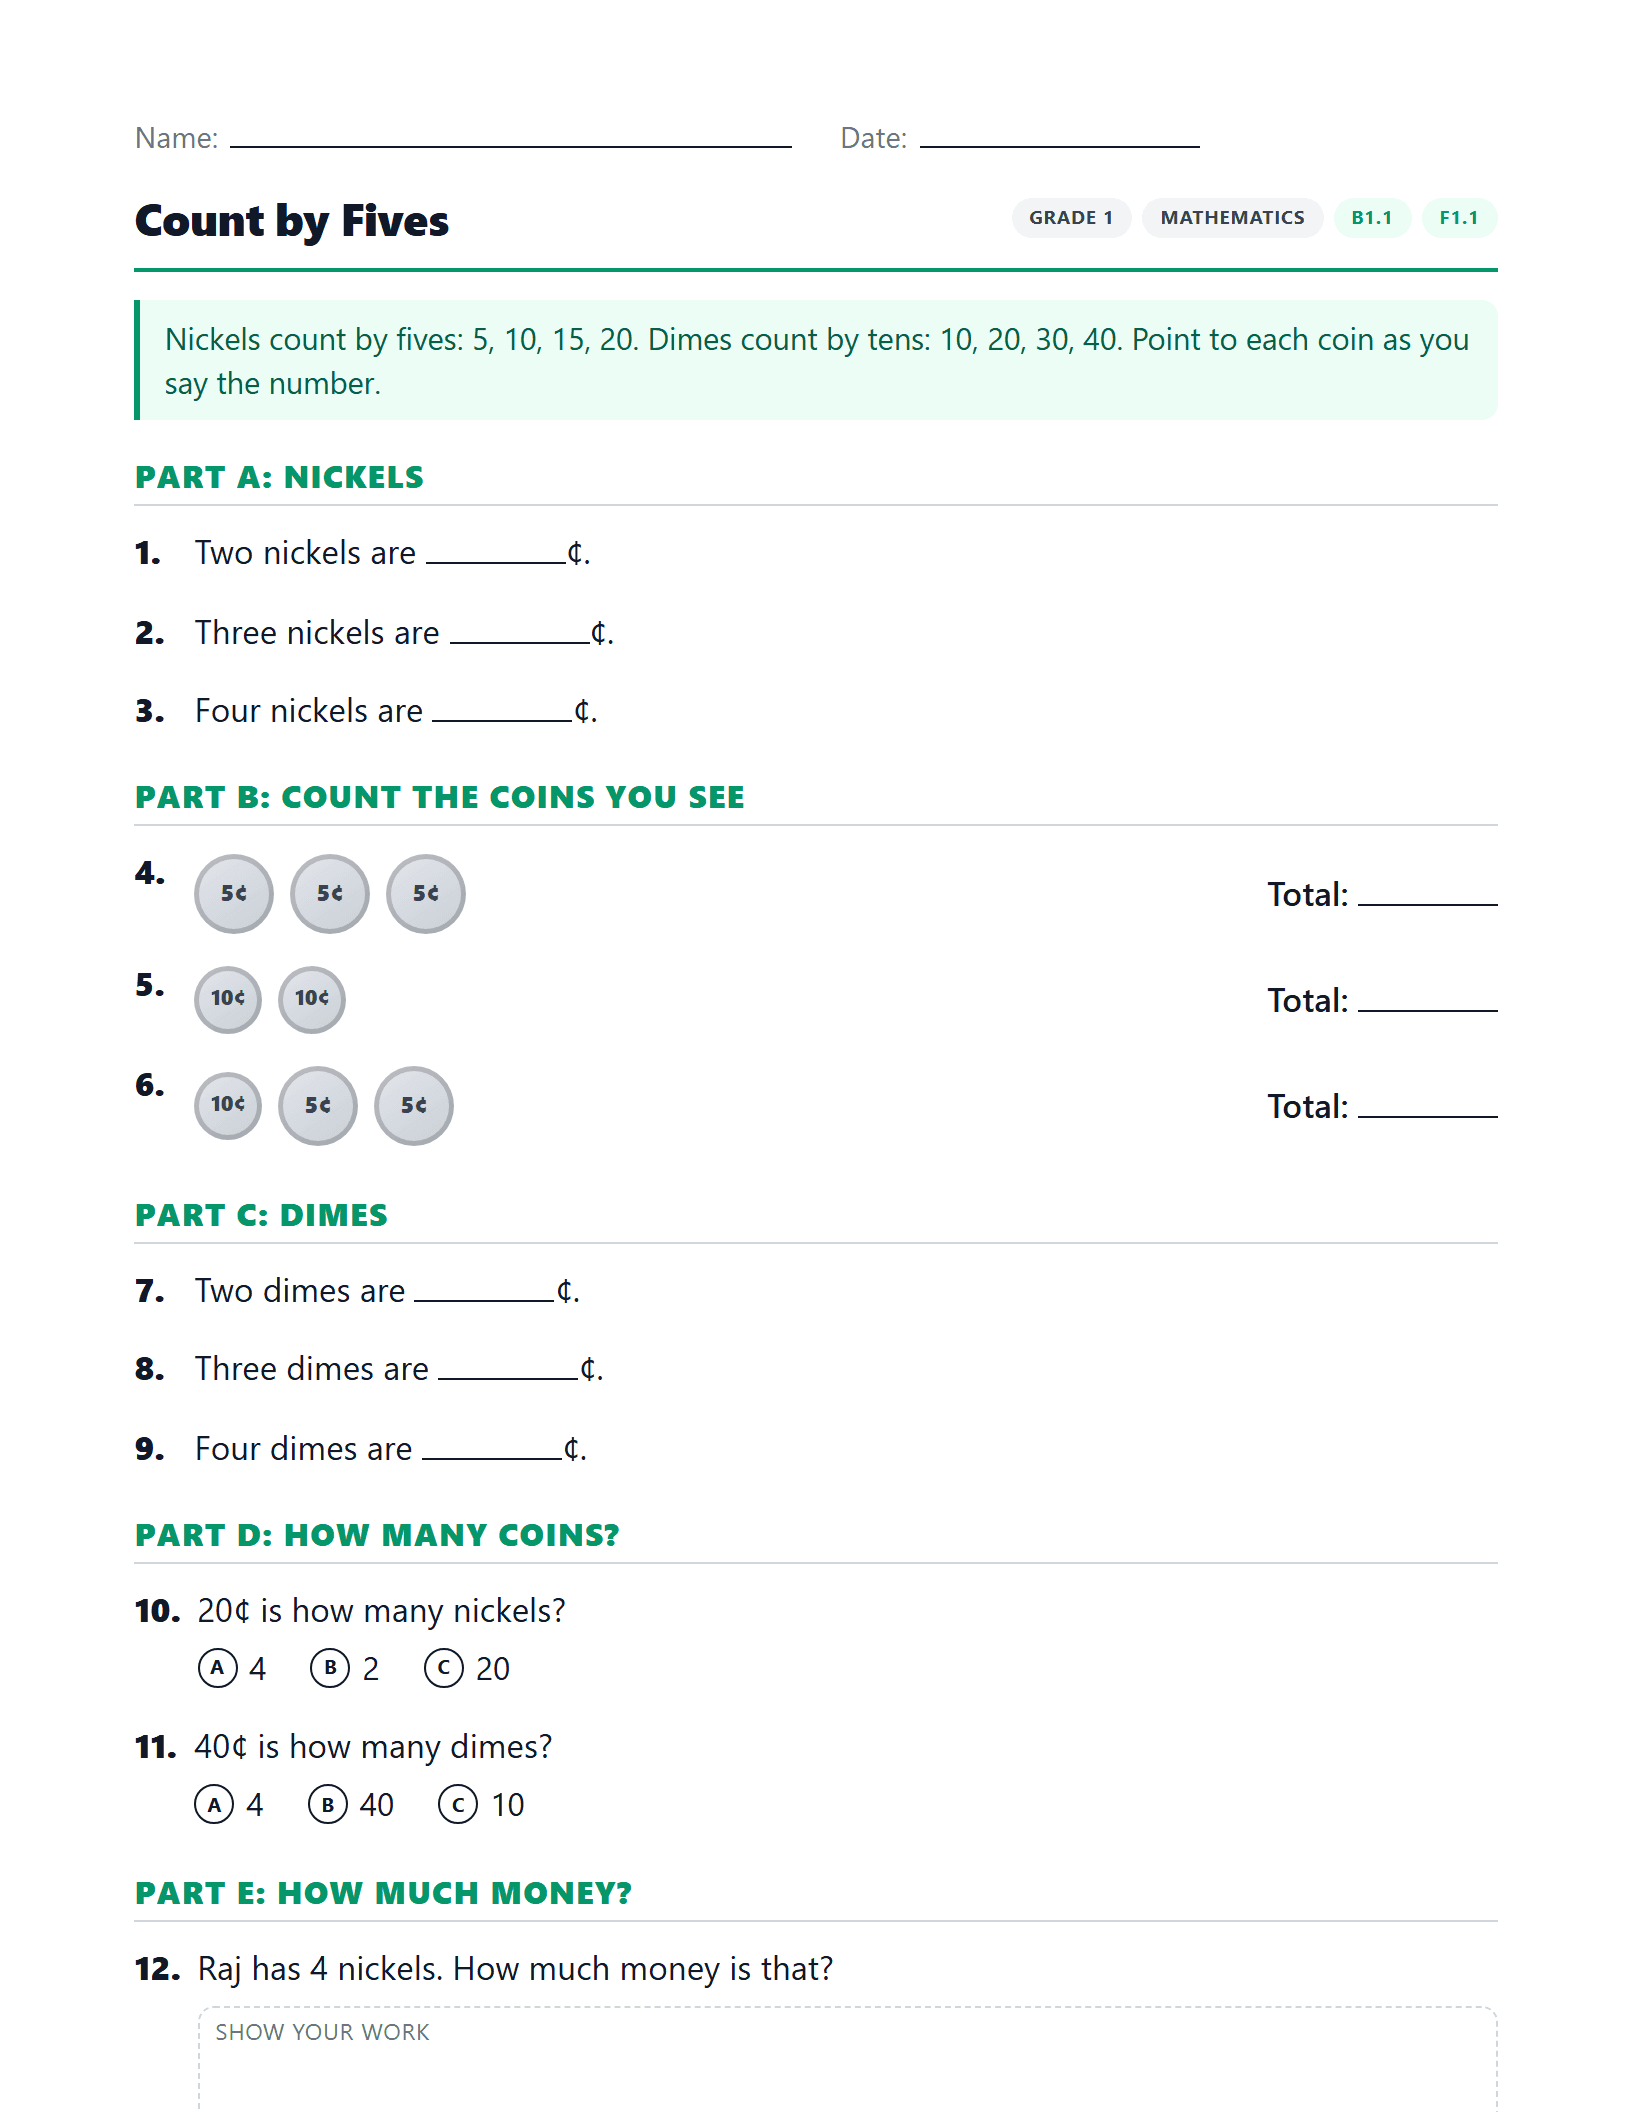
Count by Fives
Count groups of nickels by fives and groups of dimes by tens.
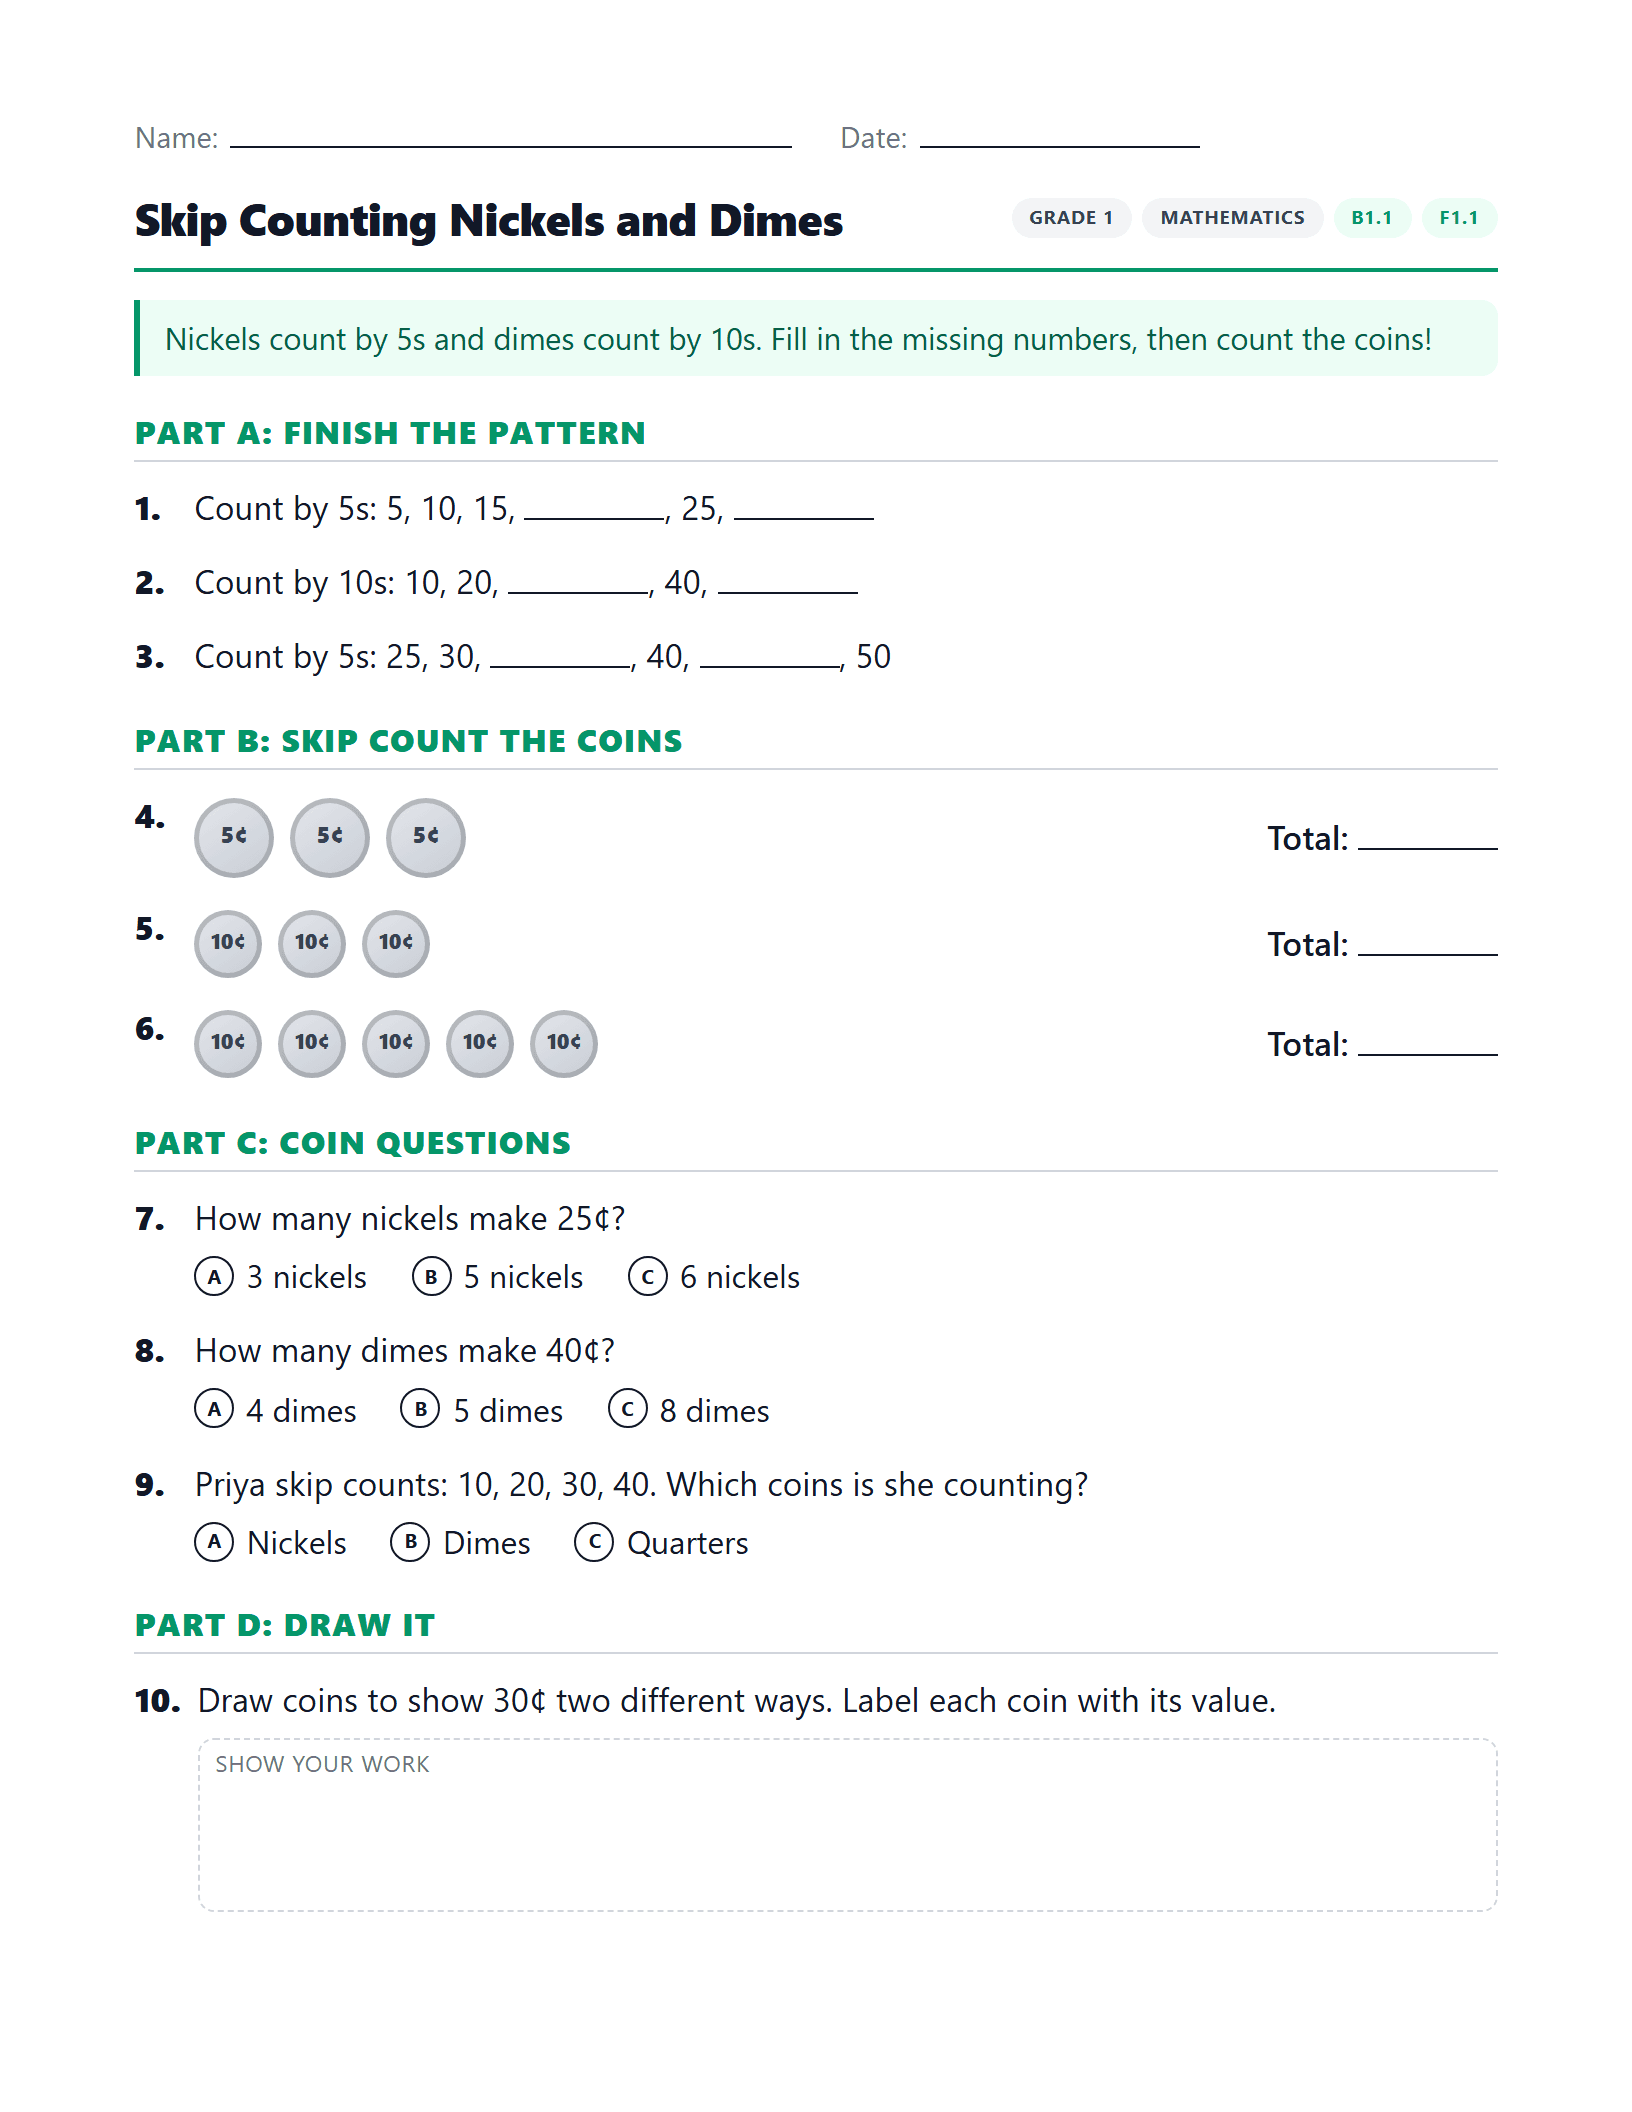
Skip Counting Nickels and Dimes
Skip count by 5s and 10s to count collections of nickels and dimes up to 50 cents.
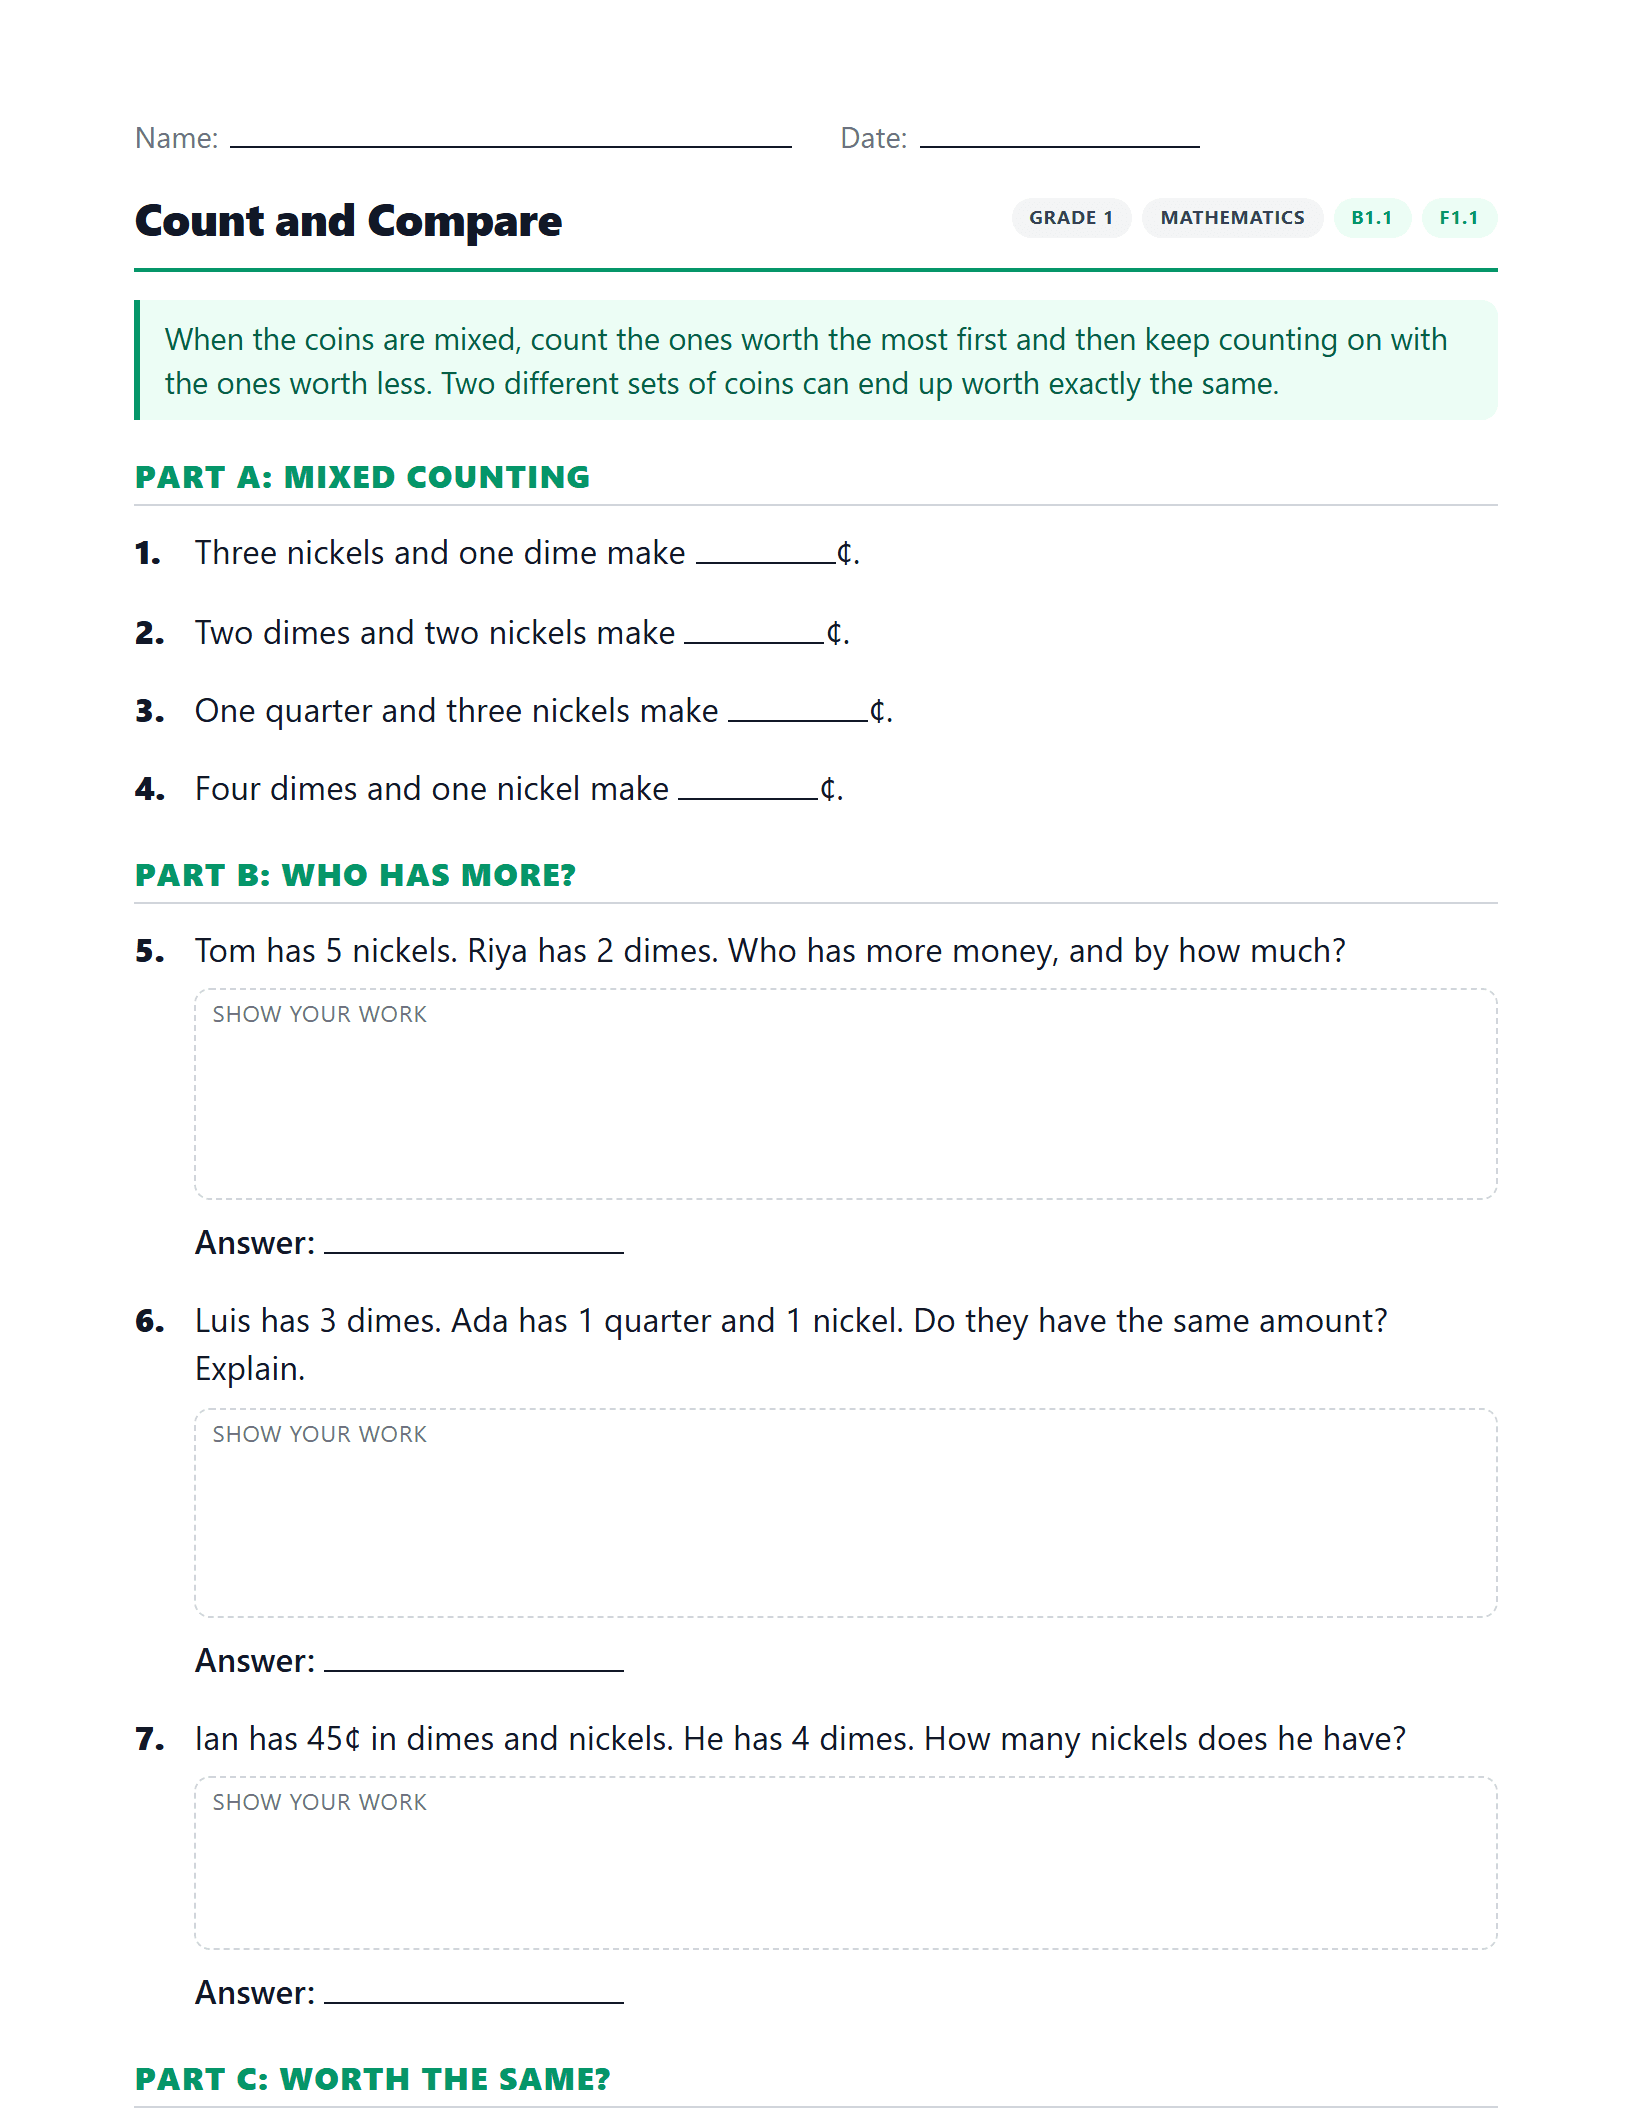
Count and Compare
Count coins of two different kinds together, then decide which of two sets is worth more.
B2.3
3 worksheetsUse mental math strategies, including estimation, to add and subtract whole numbers that add up to no more than 20, and explain the strategies used
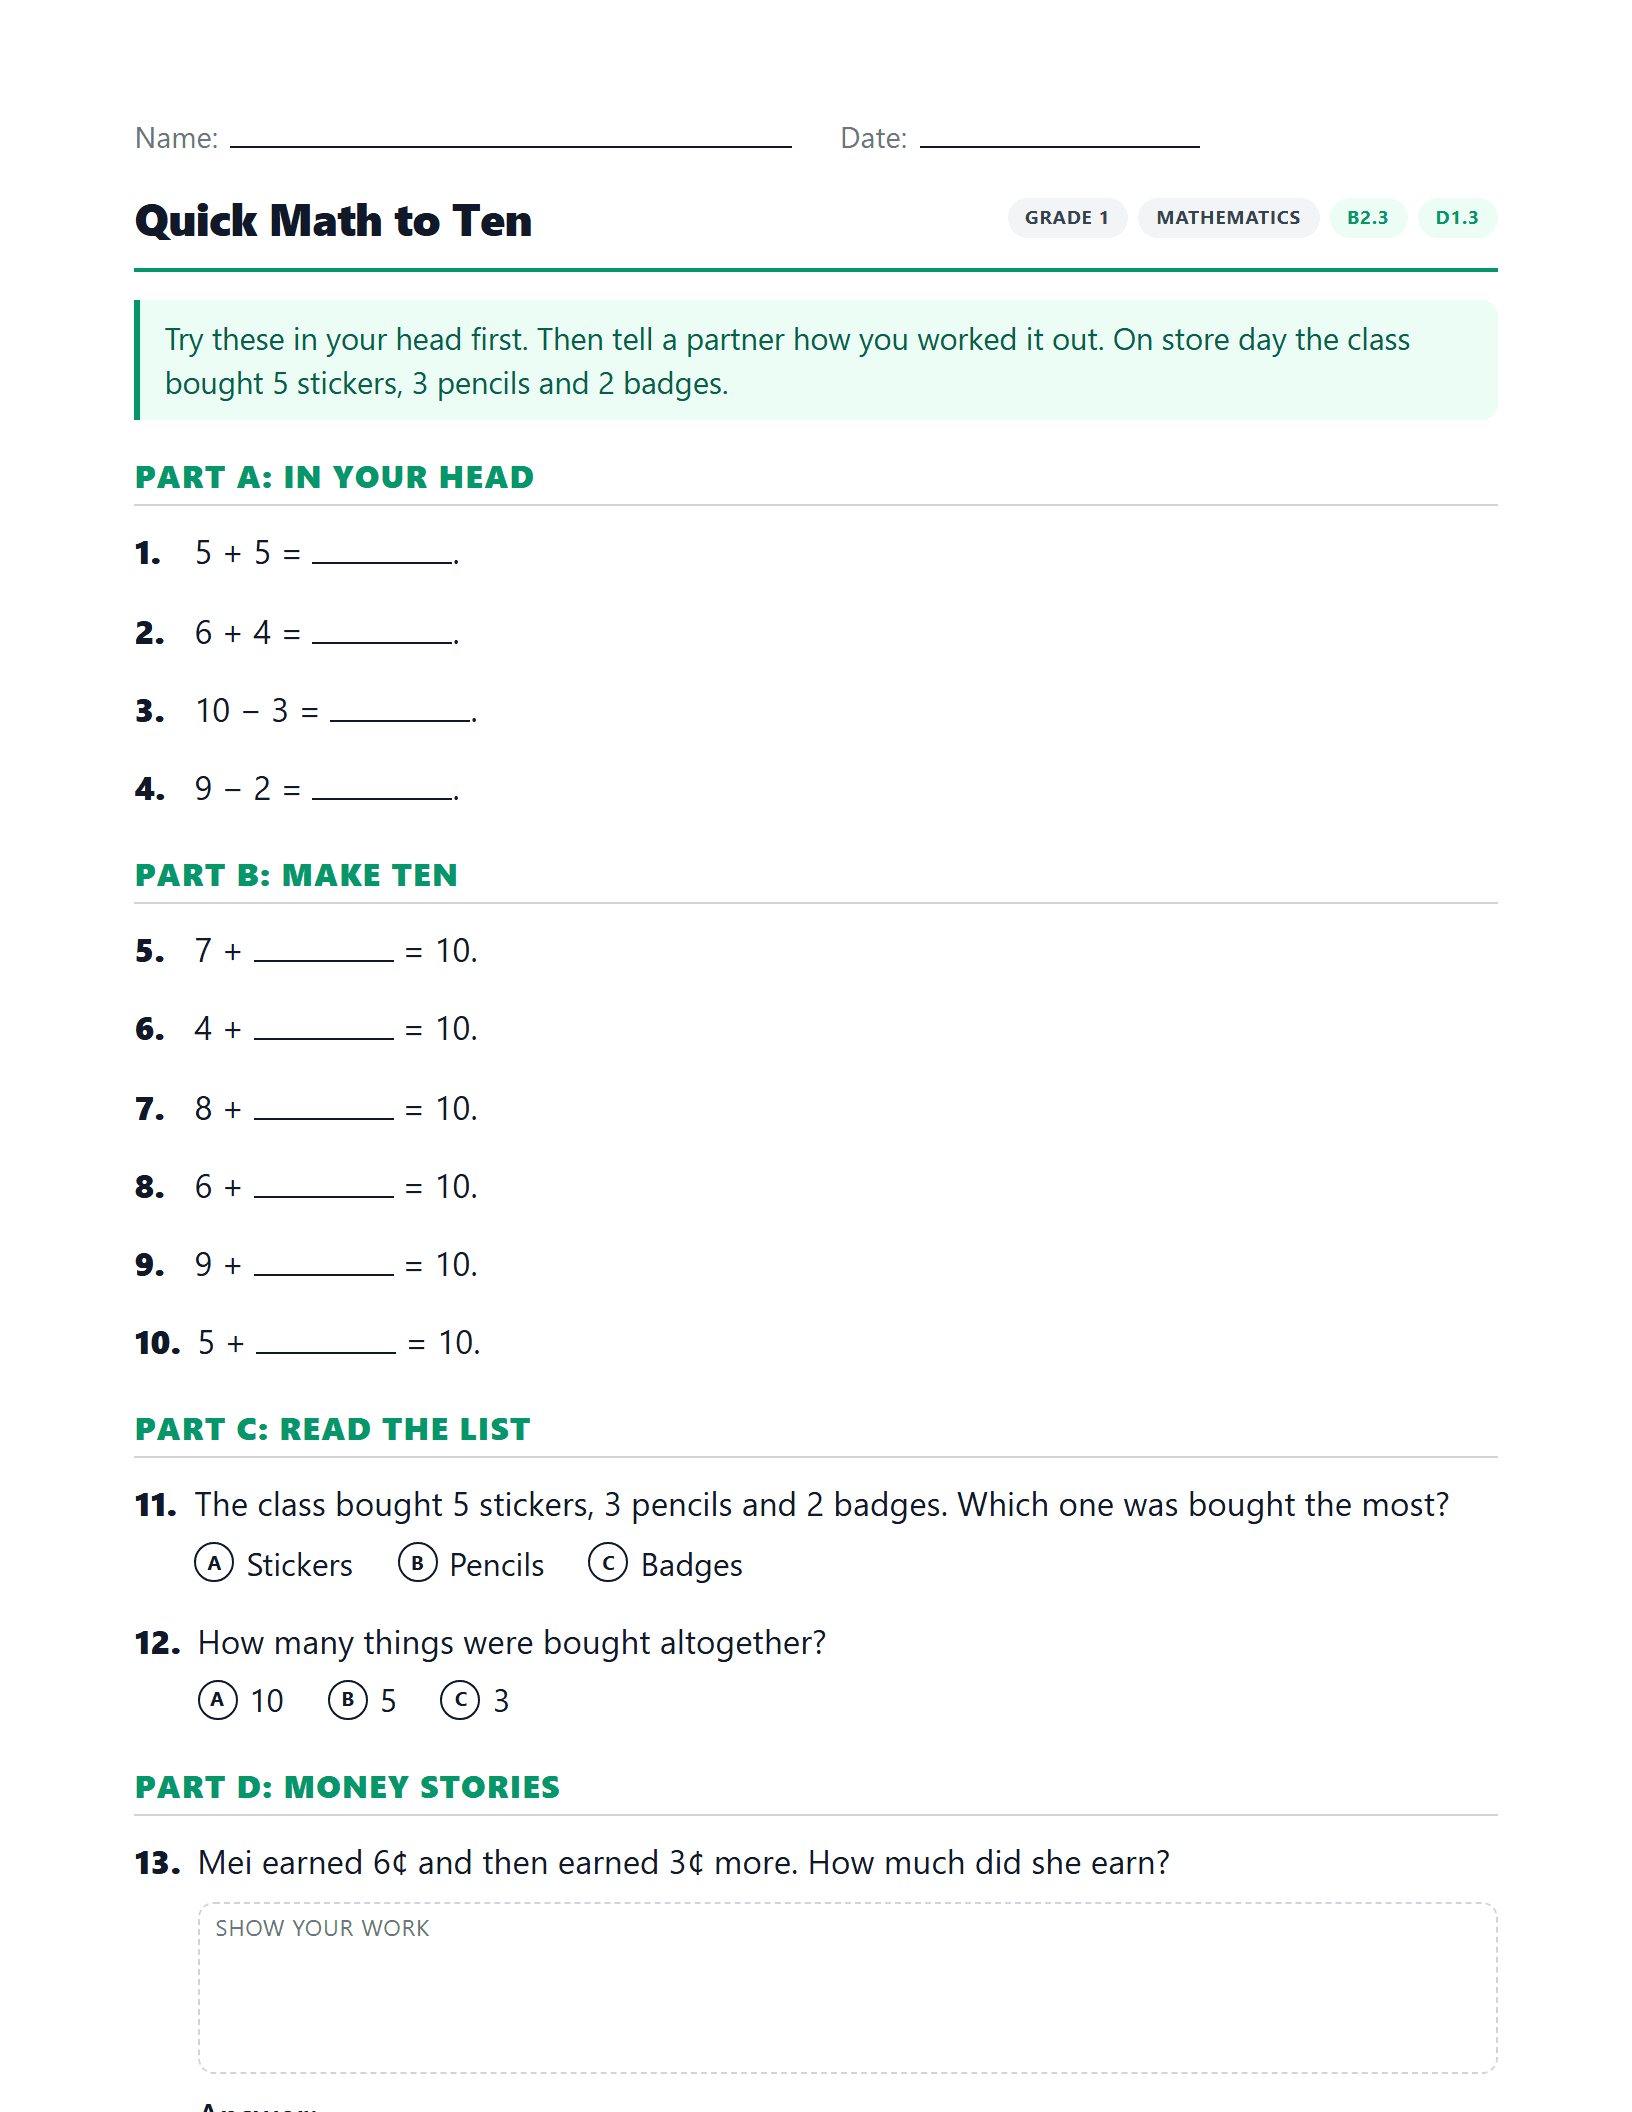
Quick Math to Ten
Do small sums in your head, make ten, and read a picture graph of store day.
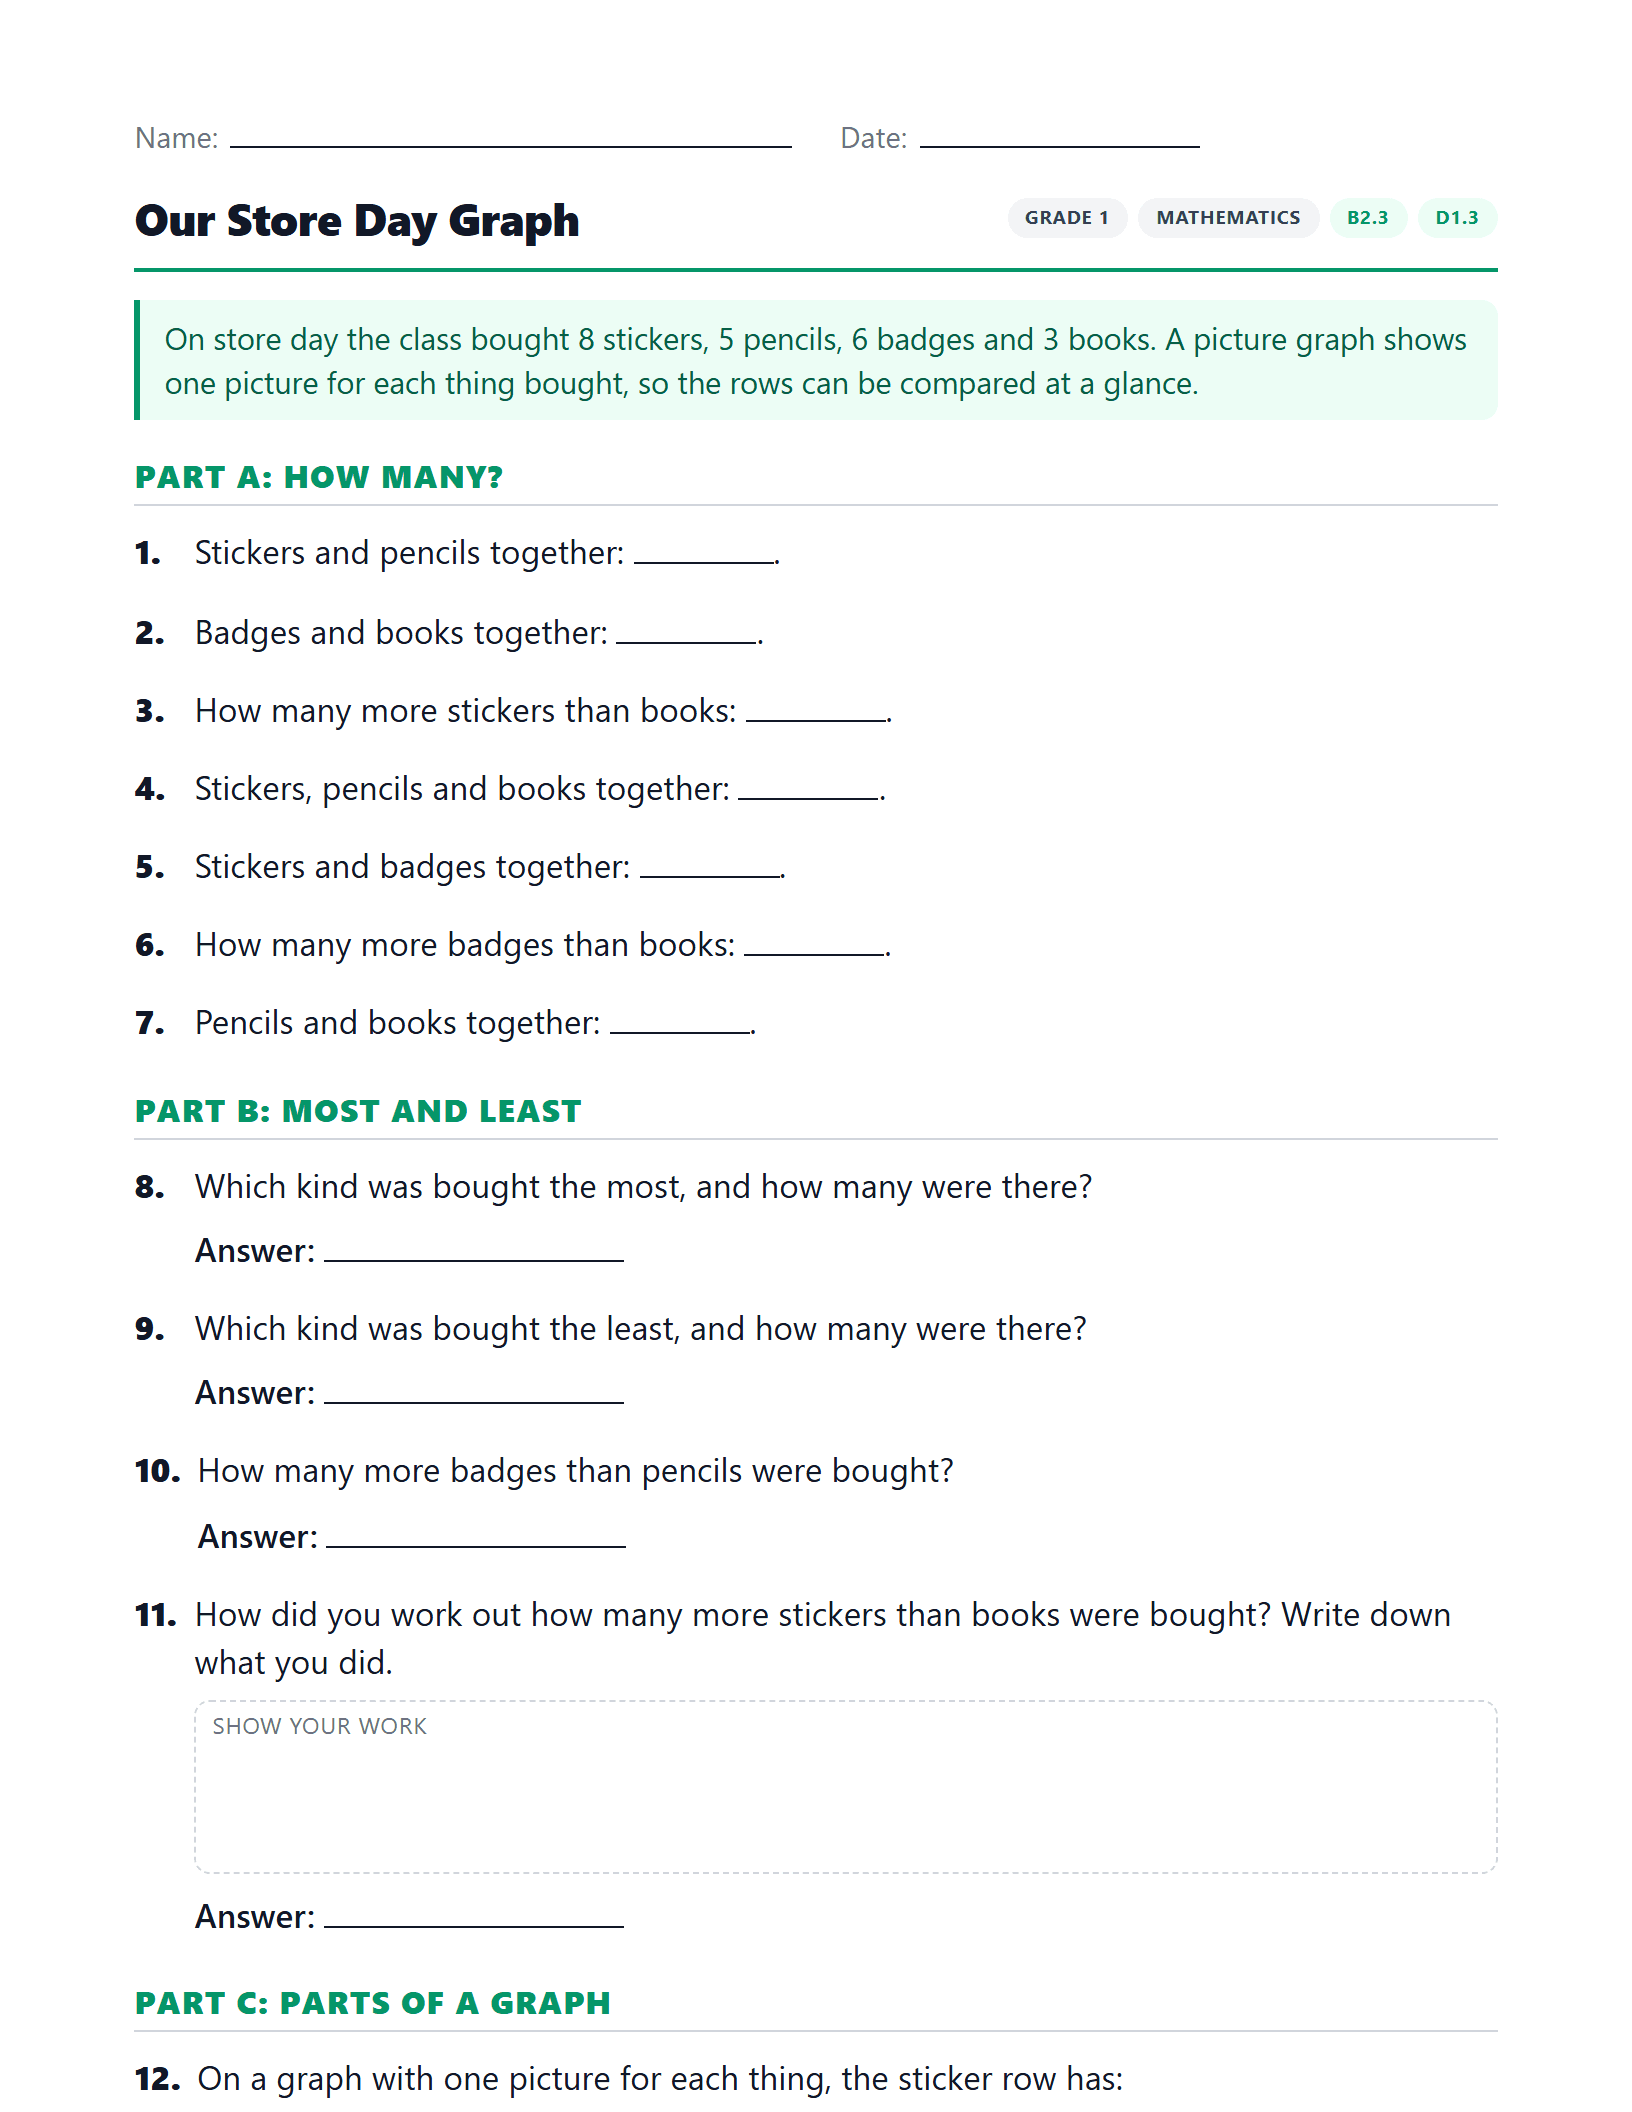
Our Store Day Graph
Add and compare four rows of store day data, then build the picture graph with a title, labels and a source.
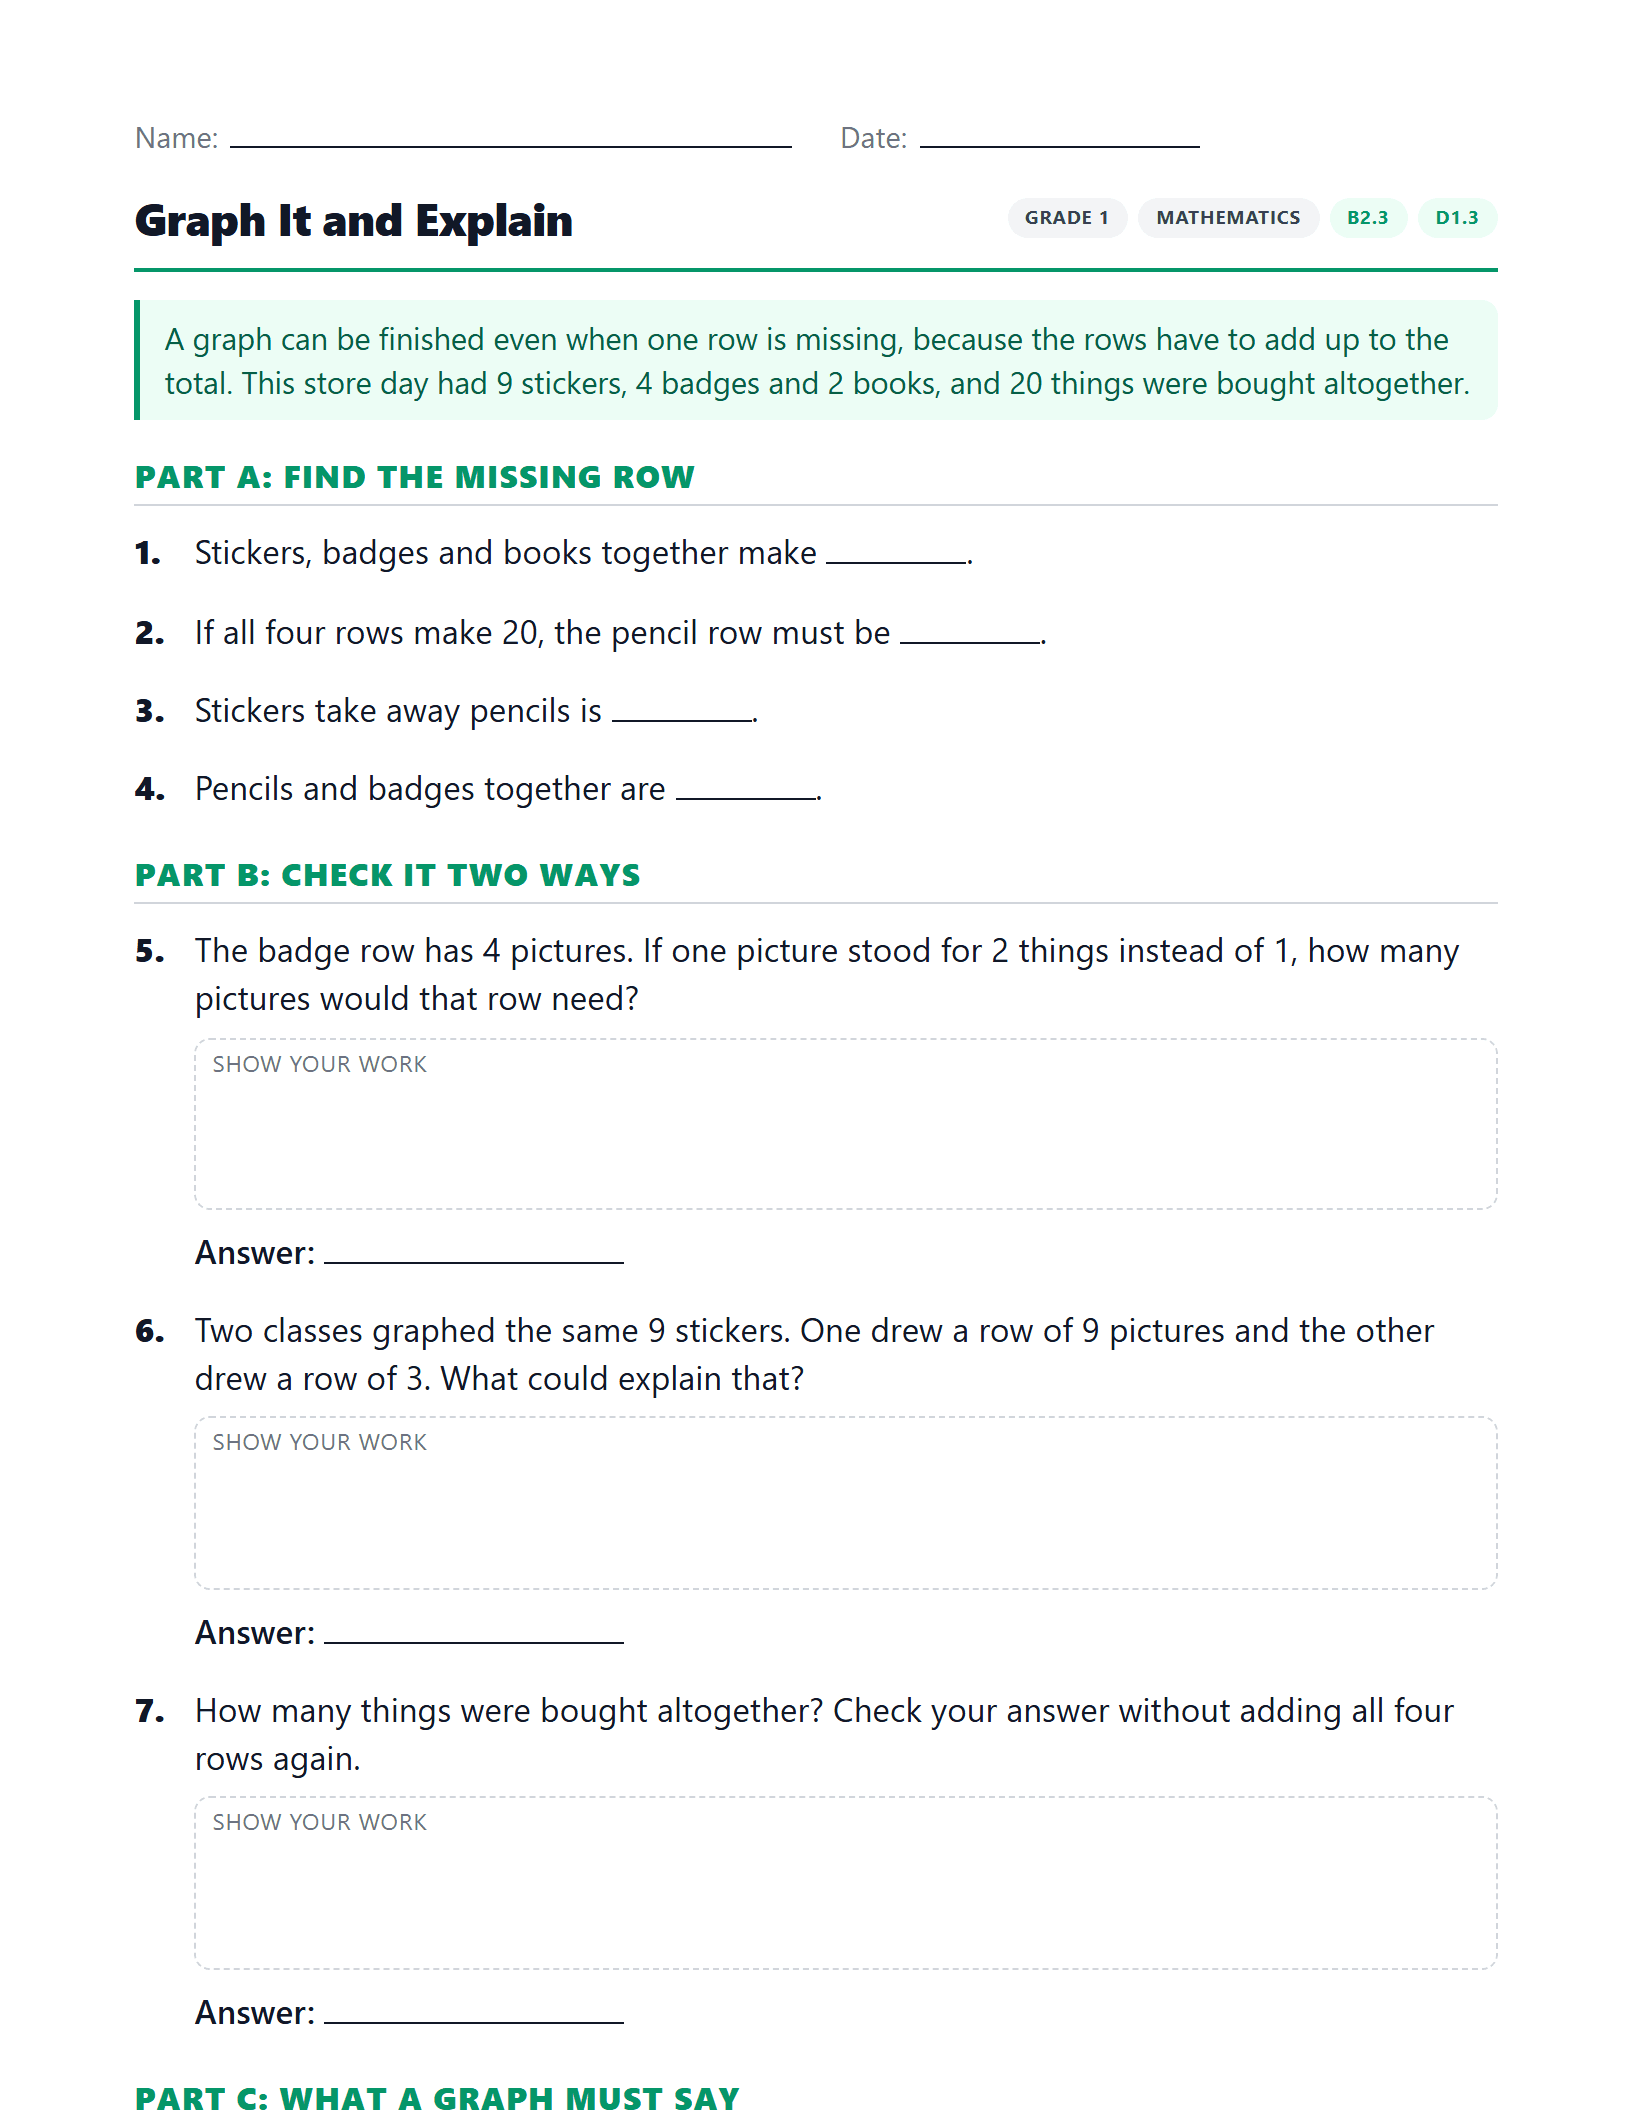
Graph It and Explain
Work out a missing row from a total, check an answer two ways, and explain why a graph needs to say what one picture means.
Want the teaching ideas behind these sheets?
See how each Grade 1 expectation connects to your classroom economy, with activity ideas for every one.