Grade 5 Ontario Worksheets
12 free printable sheets across 4 expectations, each written at up to three levels — Modified for reduced expectations, Standard for the expectation as written, and Challenge to extend beyond it — so one expectation covers the whole class. Every sheet includes a full answer key on the last page.
F1.3
3 worksheetsdesign sample basic budgets to manage finances for various earning and spending scenarios
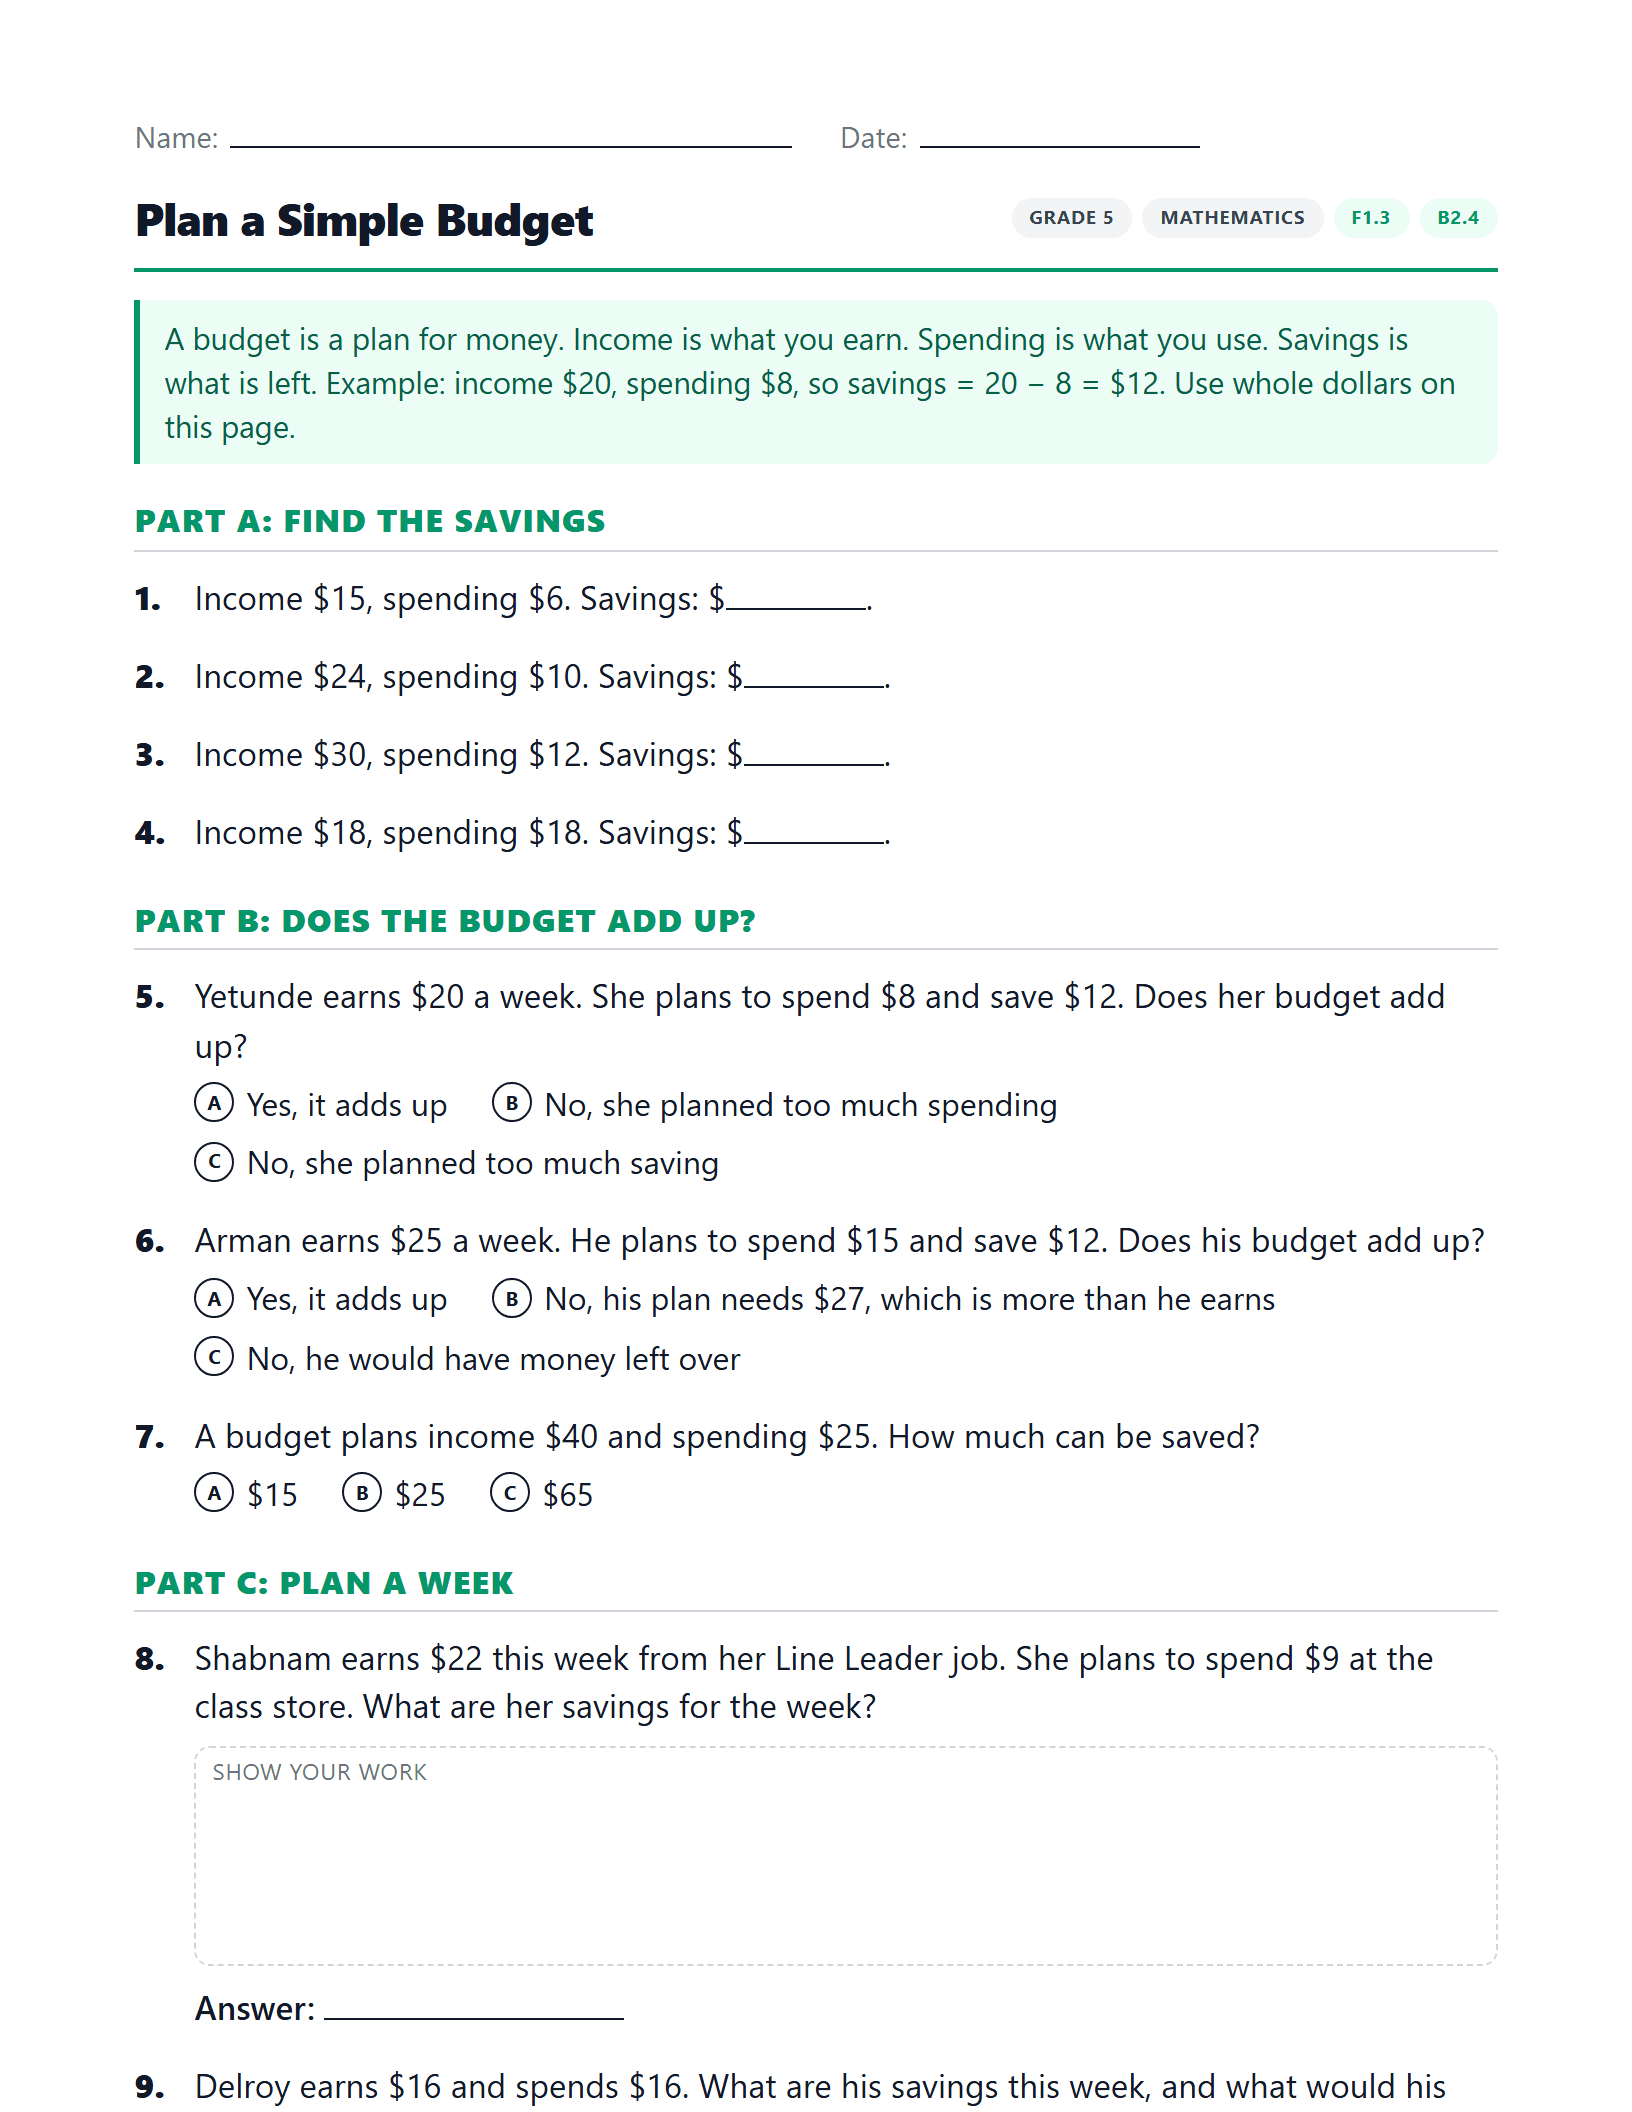
Plan a Simple Budget
Build a one-week budget in whole dollars: income, spending, and what is left to save.
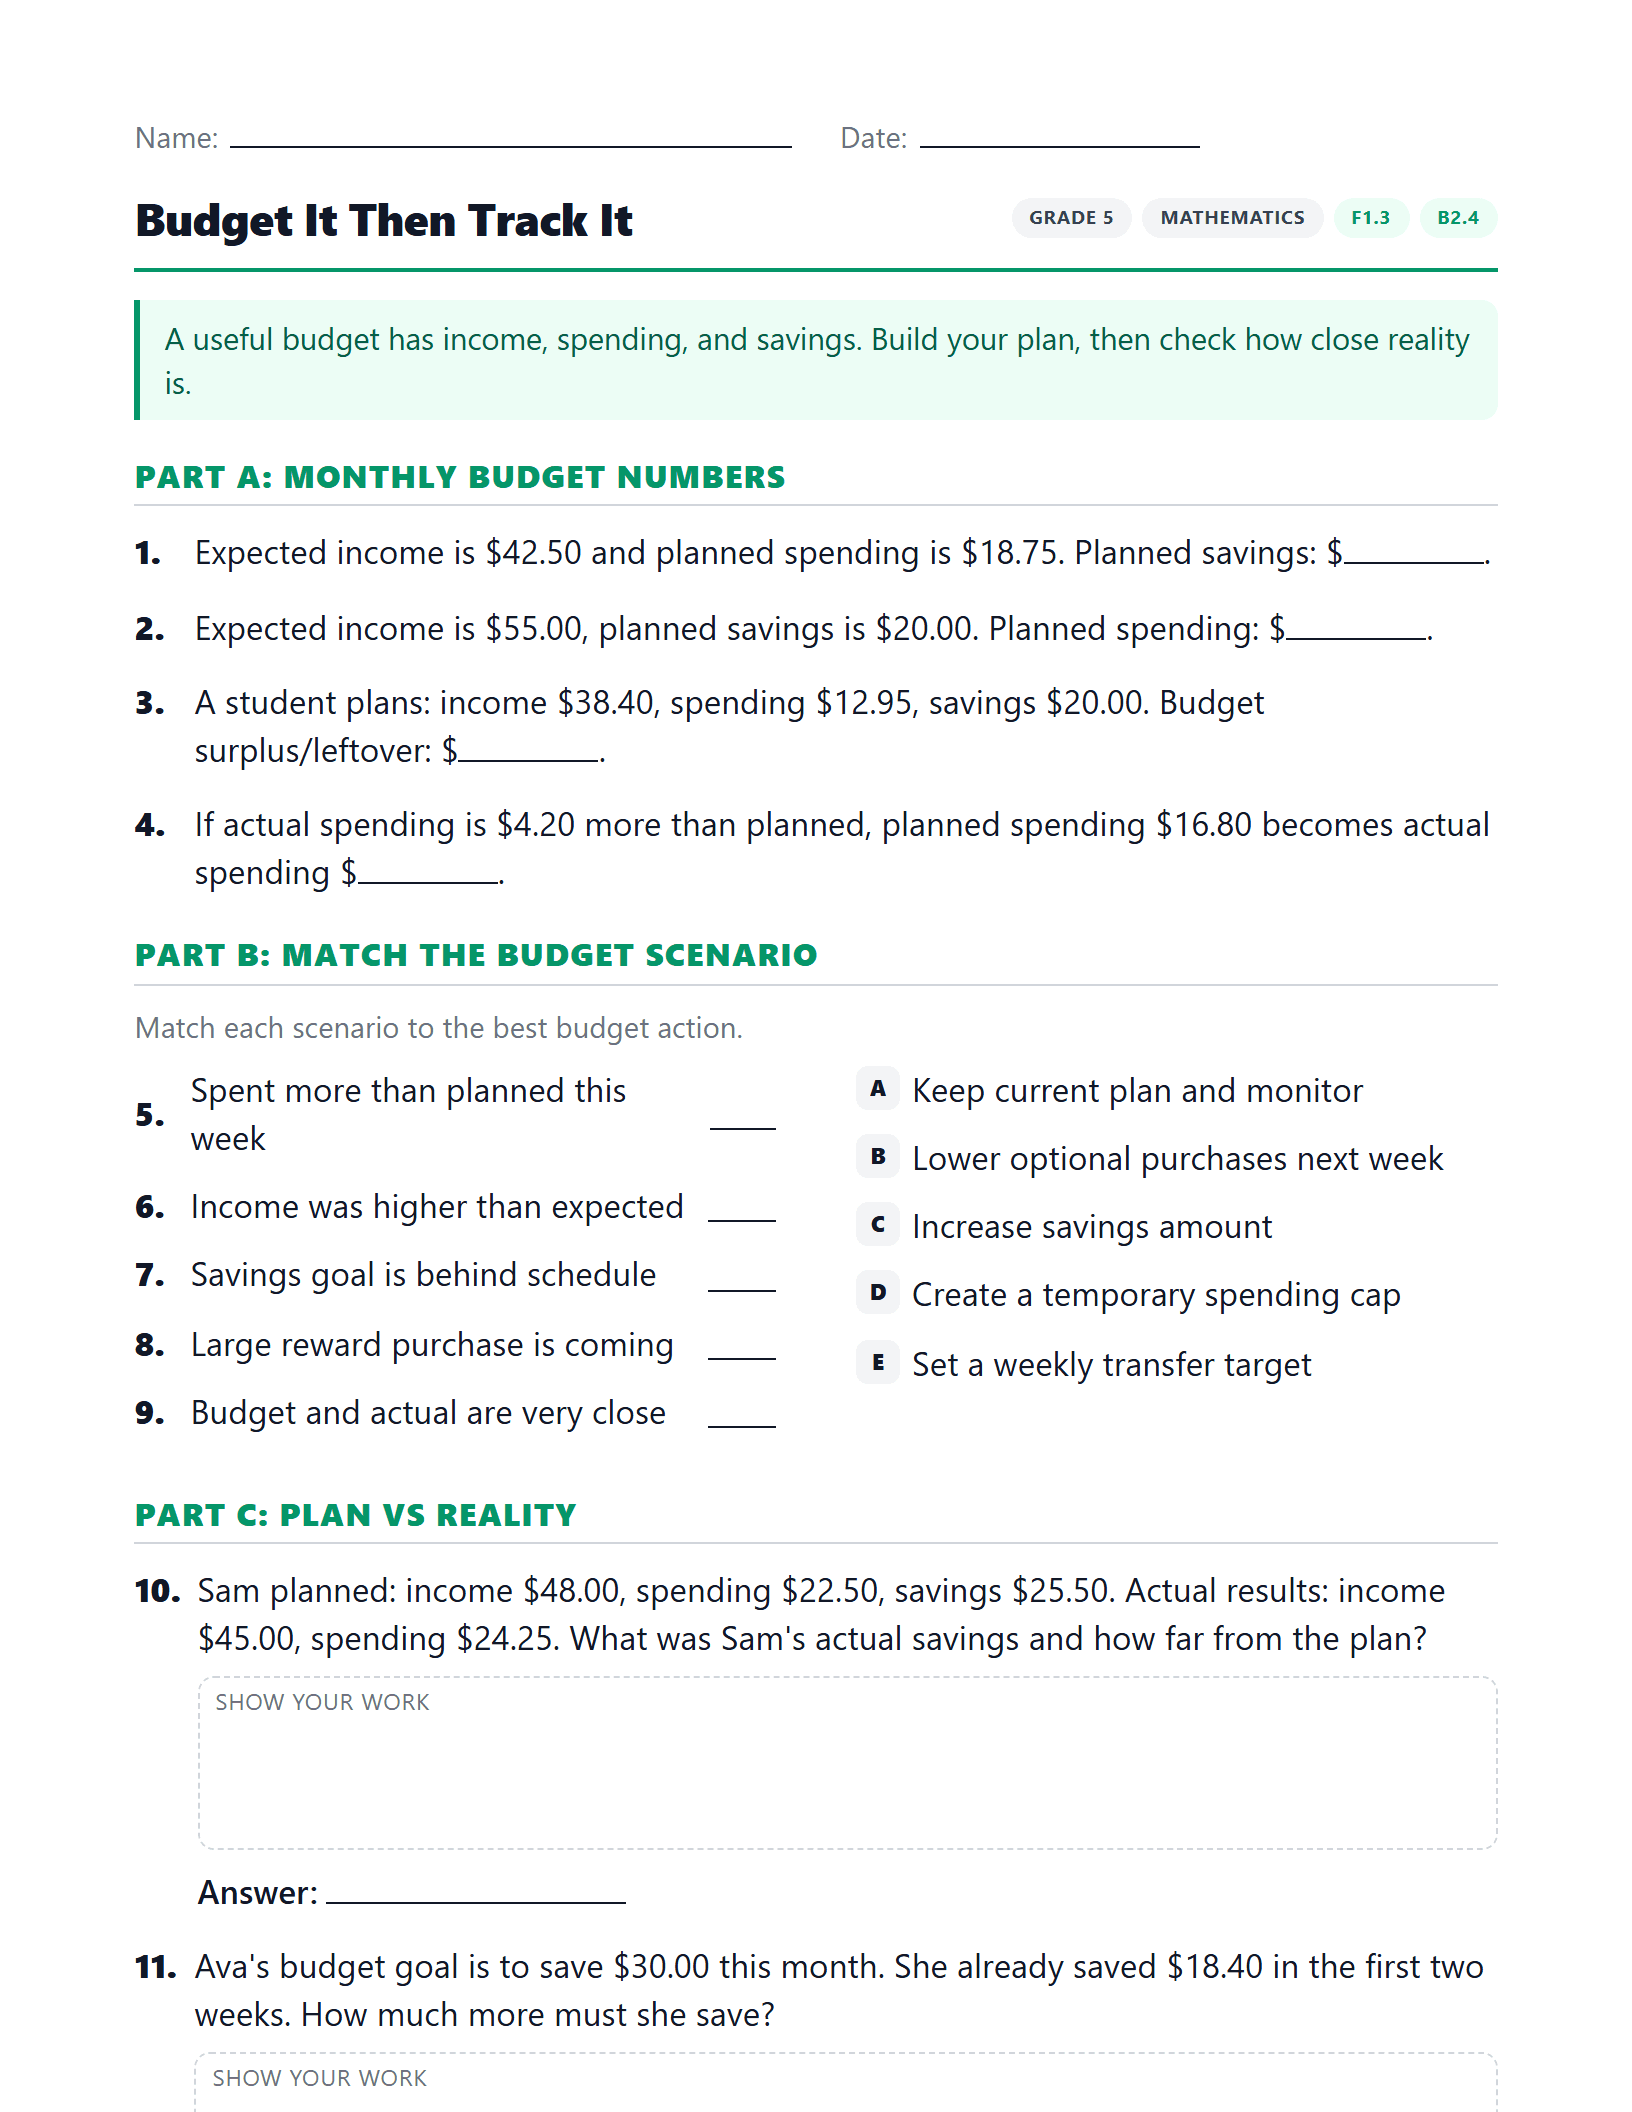
Budget It Then Track It
Design a simple budget from classroom earnings and spending, then compare the plan to actual transactions.
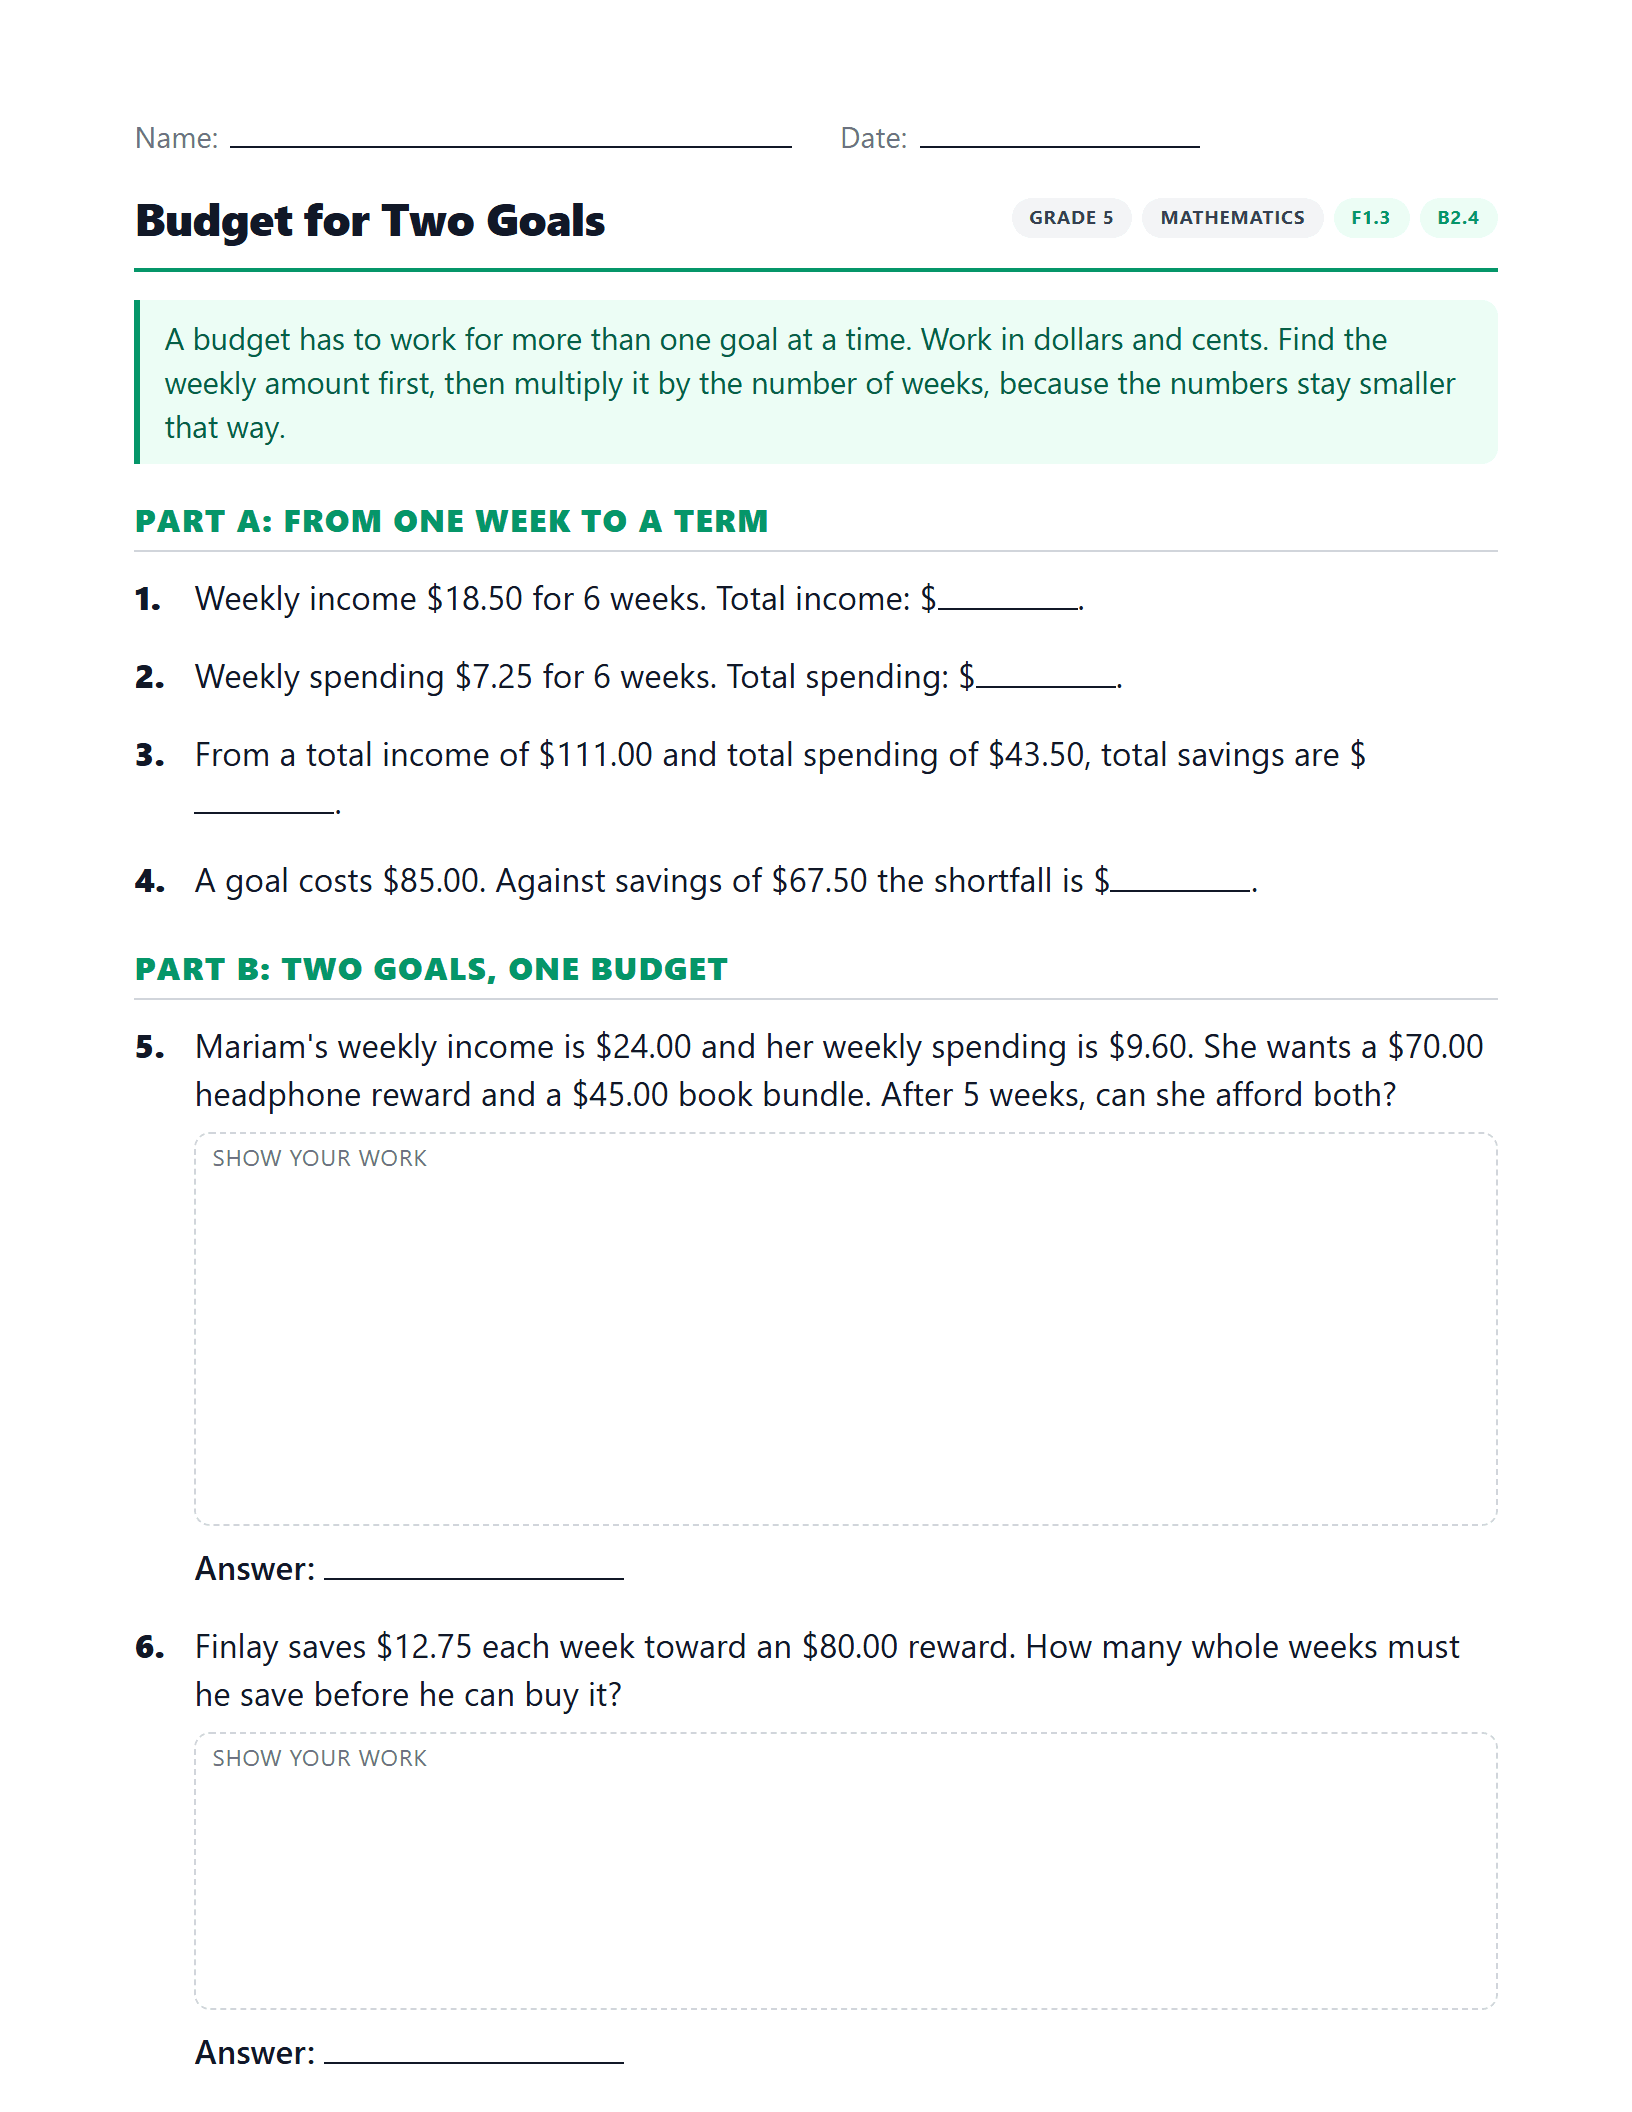
Budget for Two Goals
Design a multi-week budget when two savings goals compete for the same money, and defend the one you choose.
D1.3
3 worksheetsSelect from among a variety of graphs, including stacked-bar graphs, the type of graph best suited to represent various sets of data; display the data in the graphs with proper sources, titles, and labels, and appropriate scales; and justify their choice of graphs
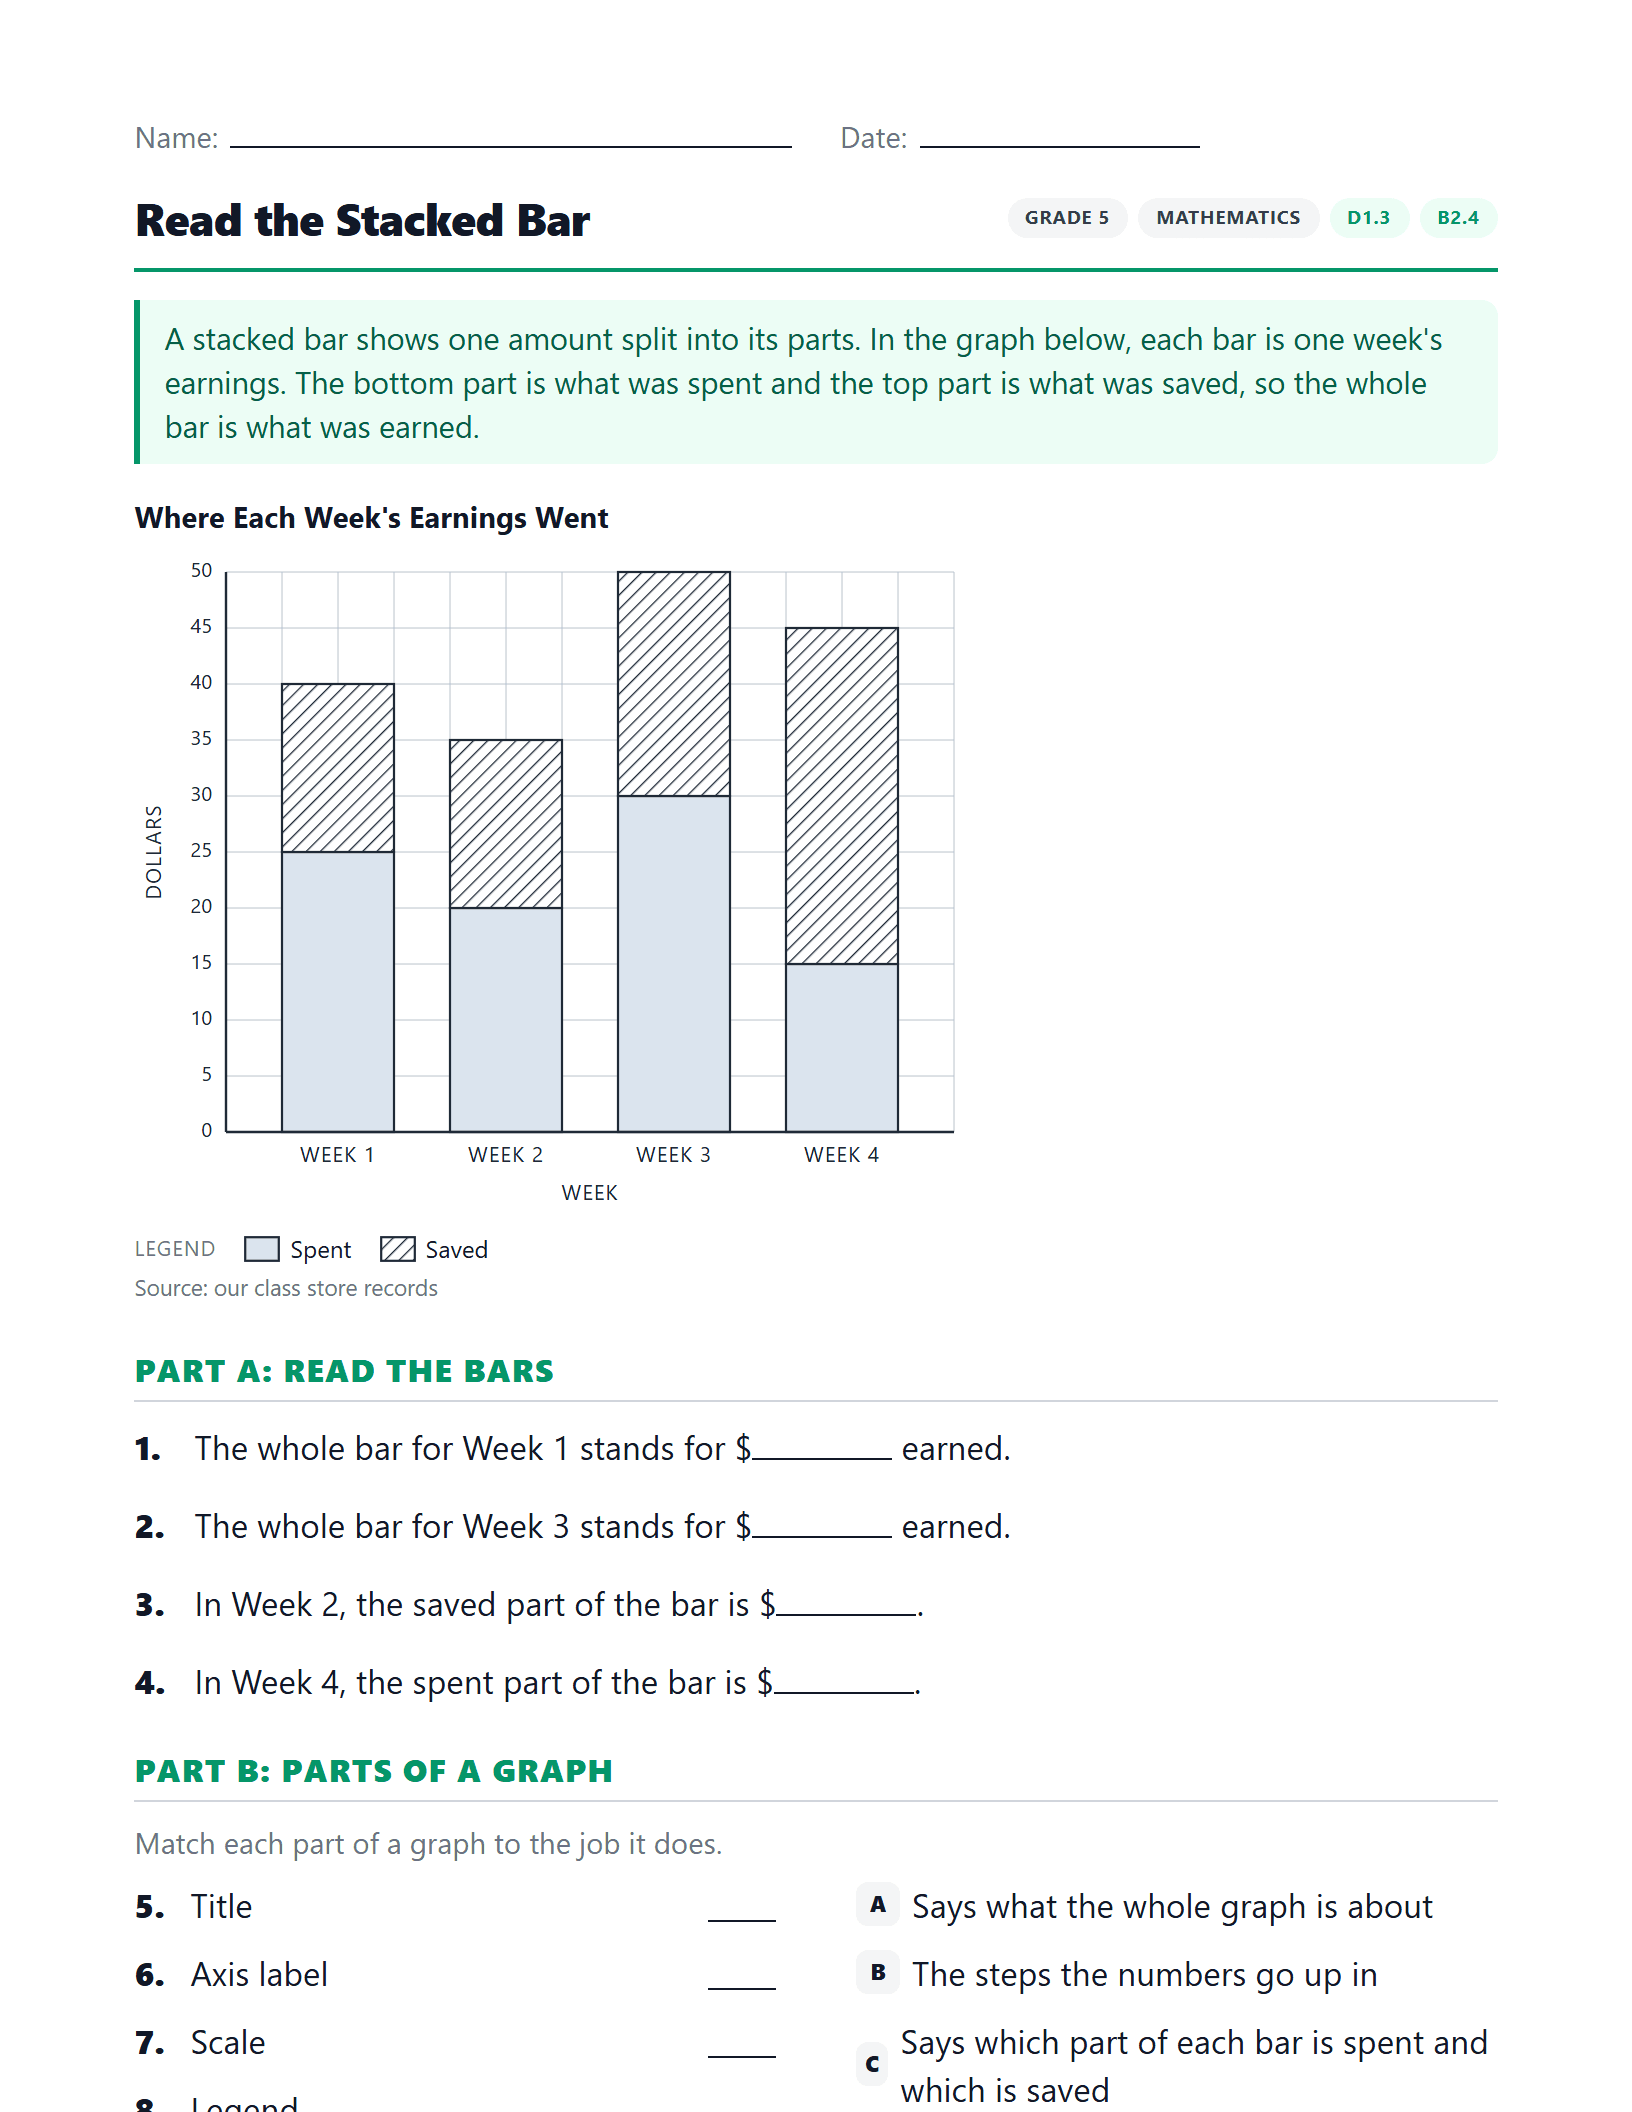
Read the Stacked Bar
Read the spent and saved parts off a stacked-bar graph of four weeks' earnings, and learn what each part of a graph is called.
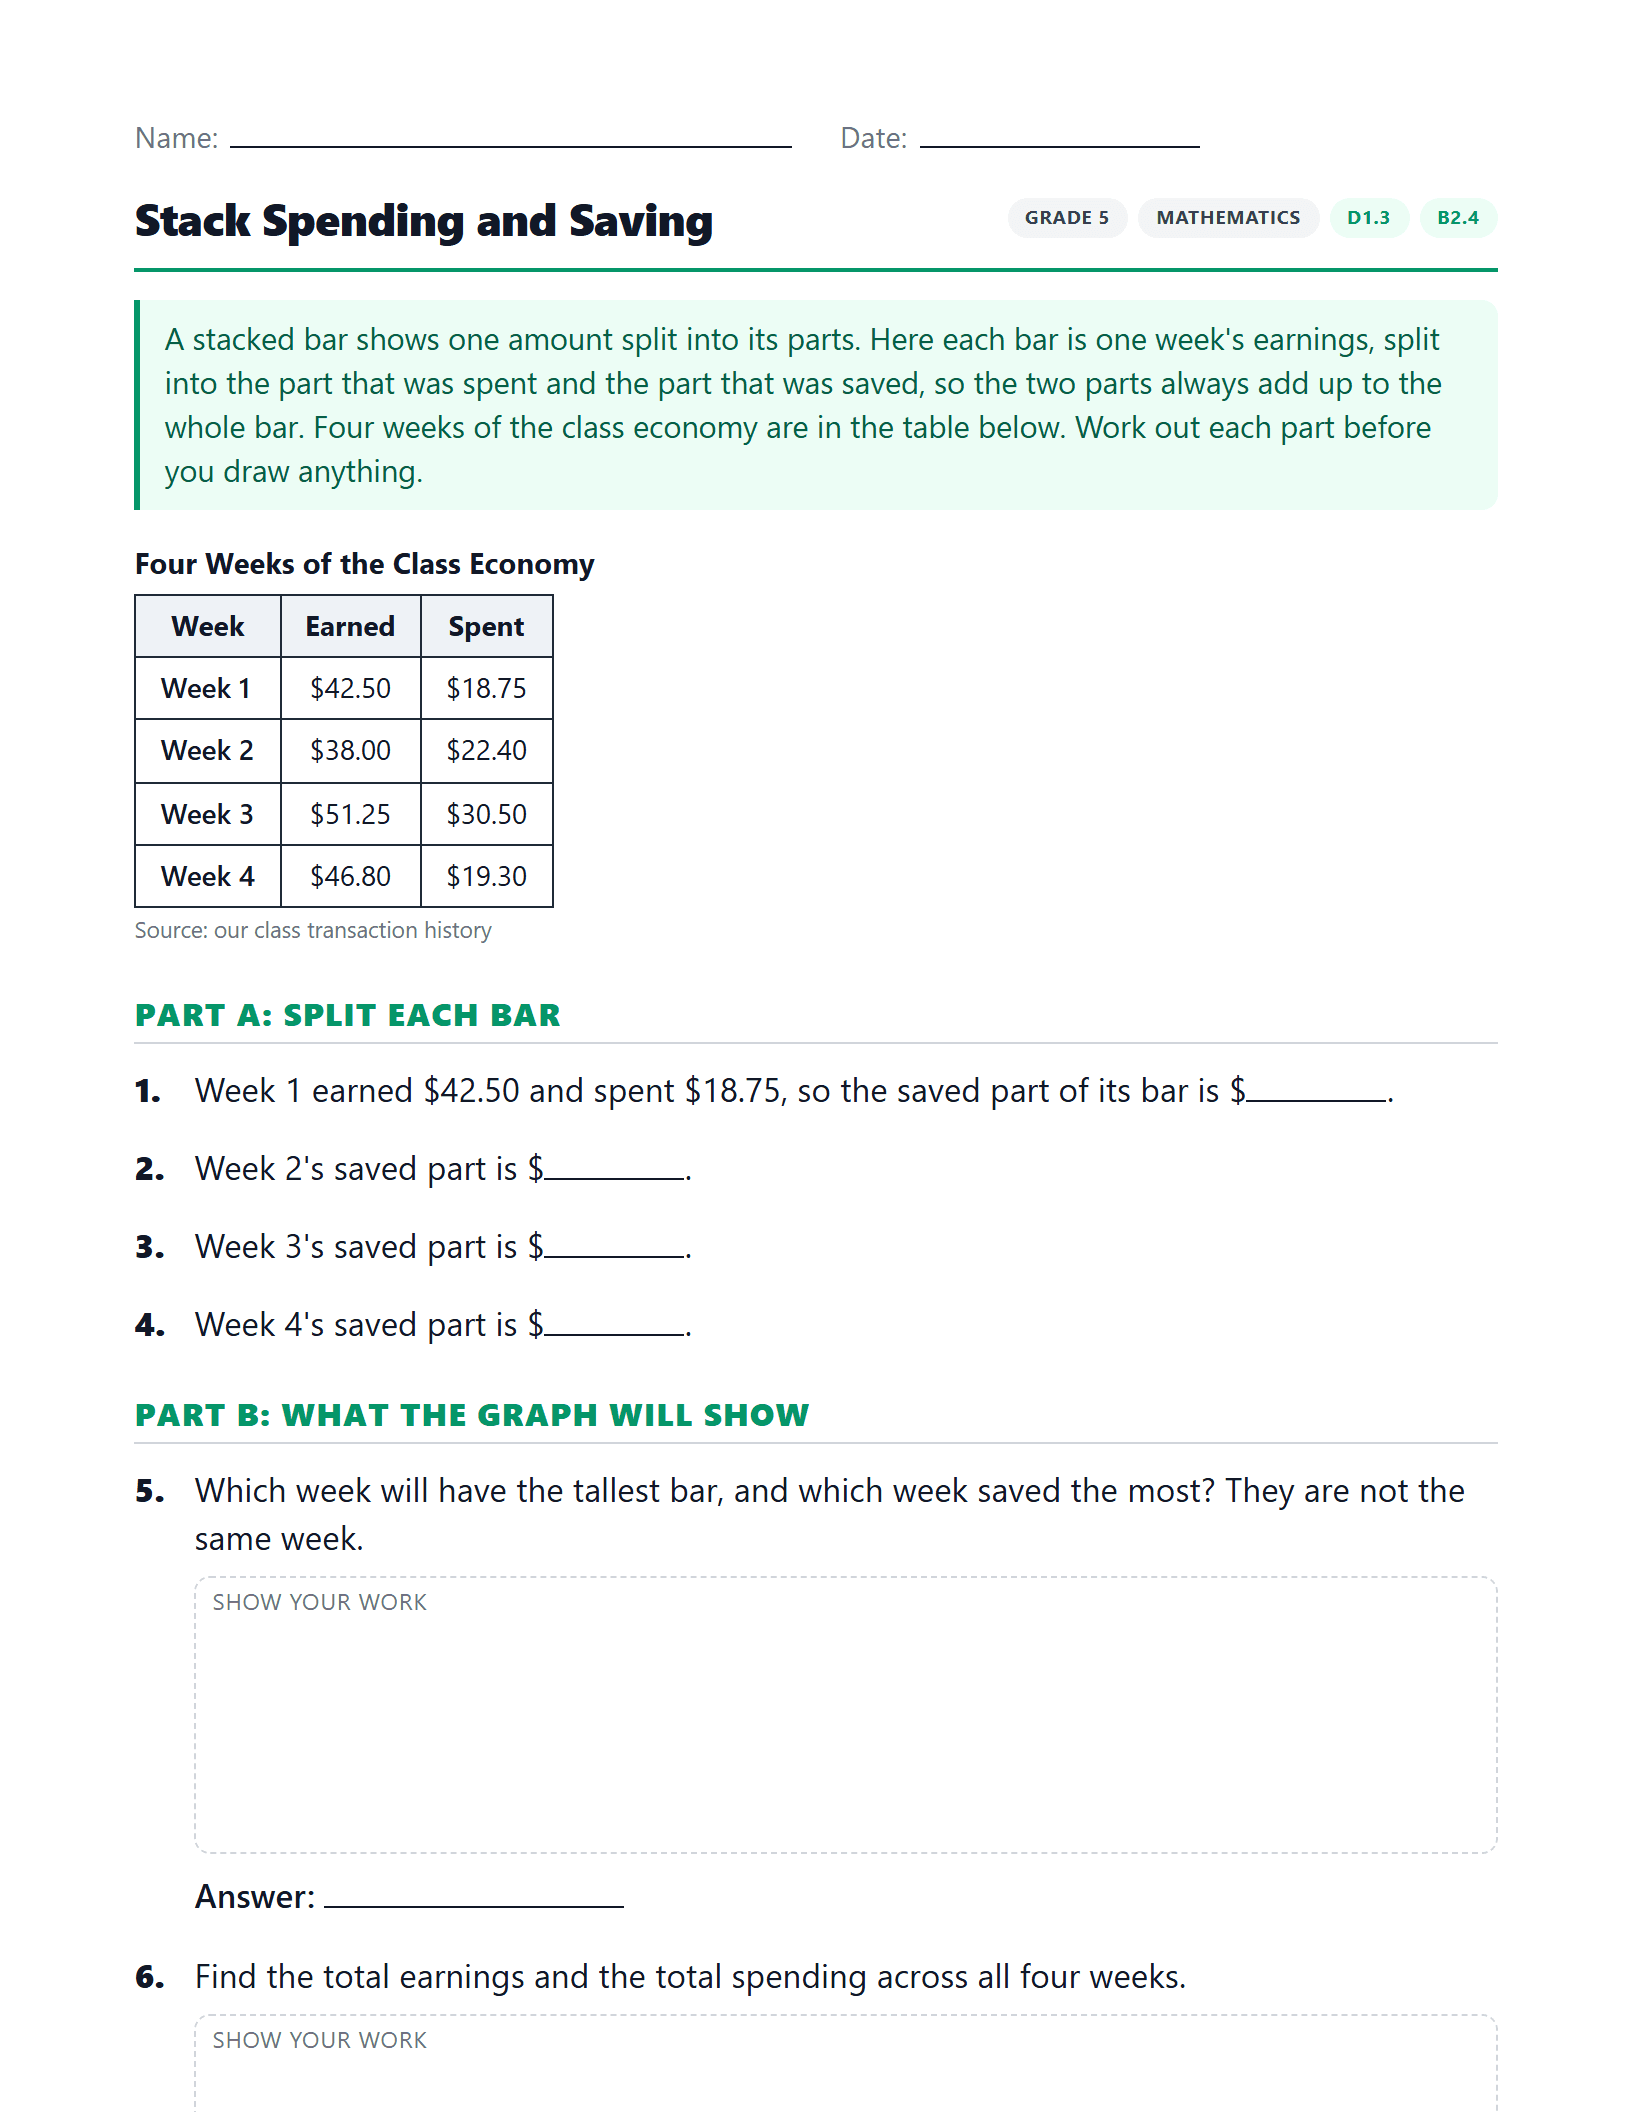
Stack Spending and Saving
Split four weeks of earnings into what was spent and what was saved, then build the stacked-bar graph with a title, labels, scale, legend and source.
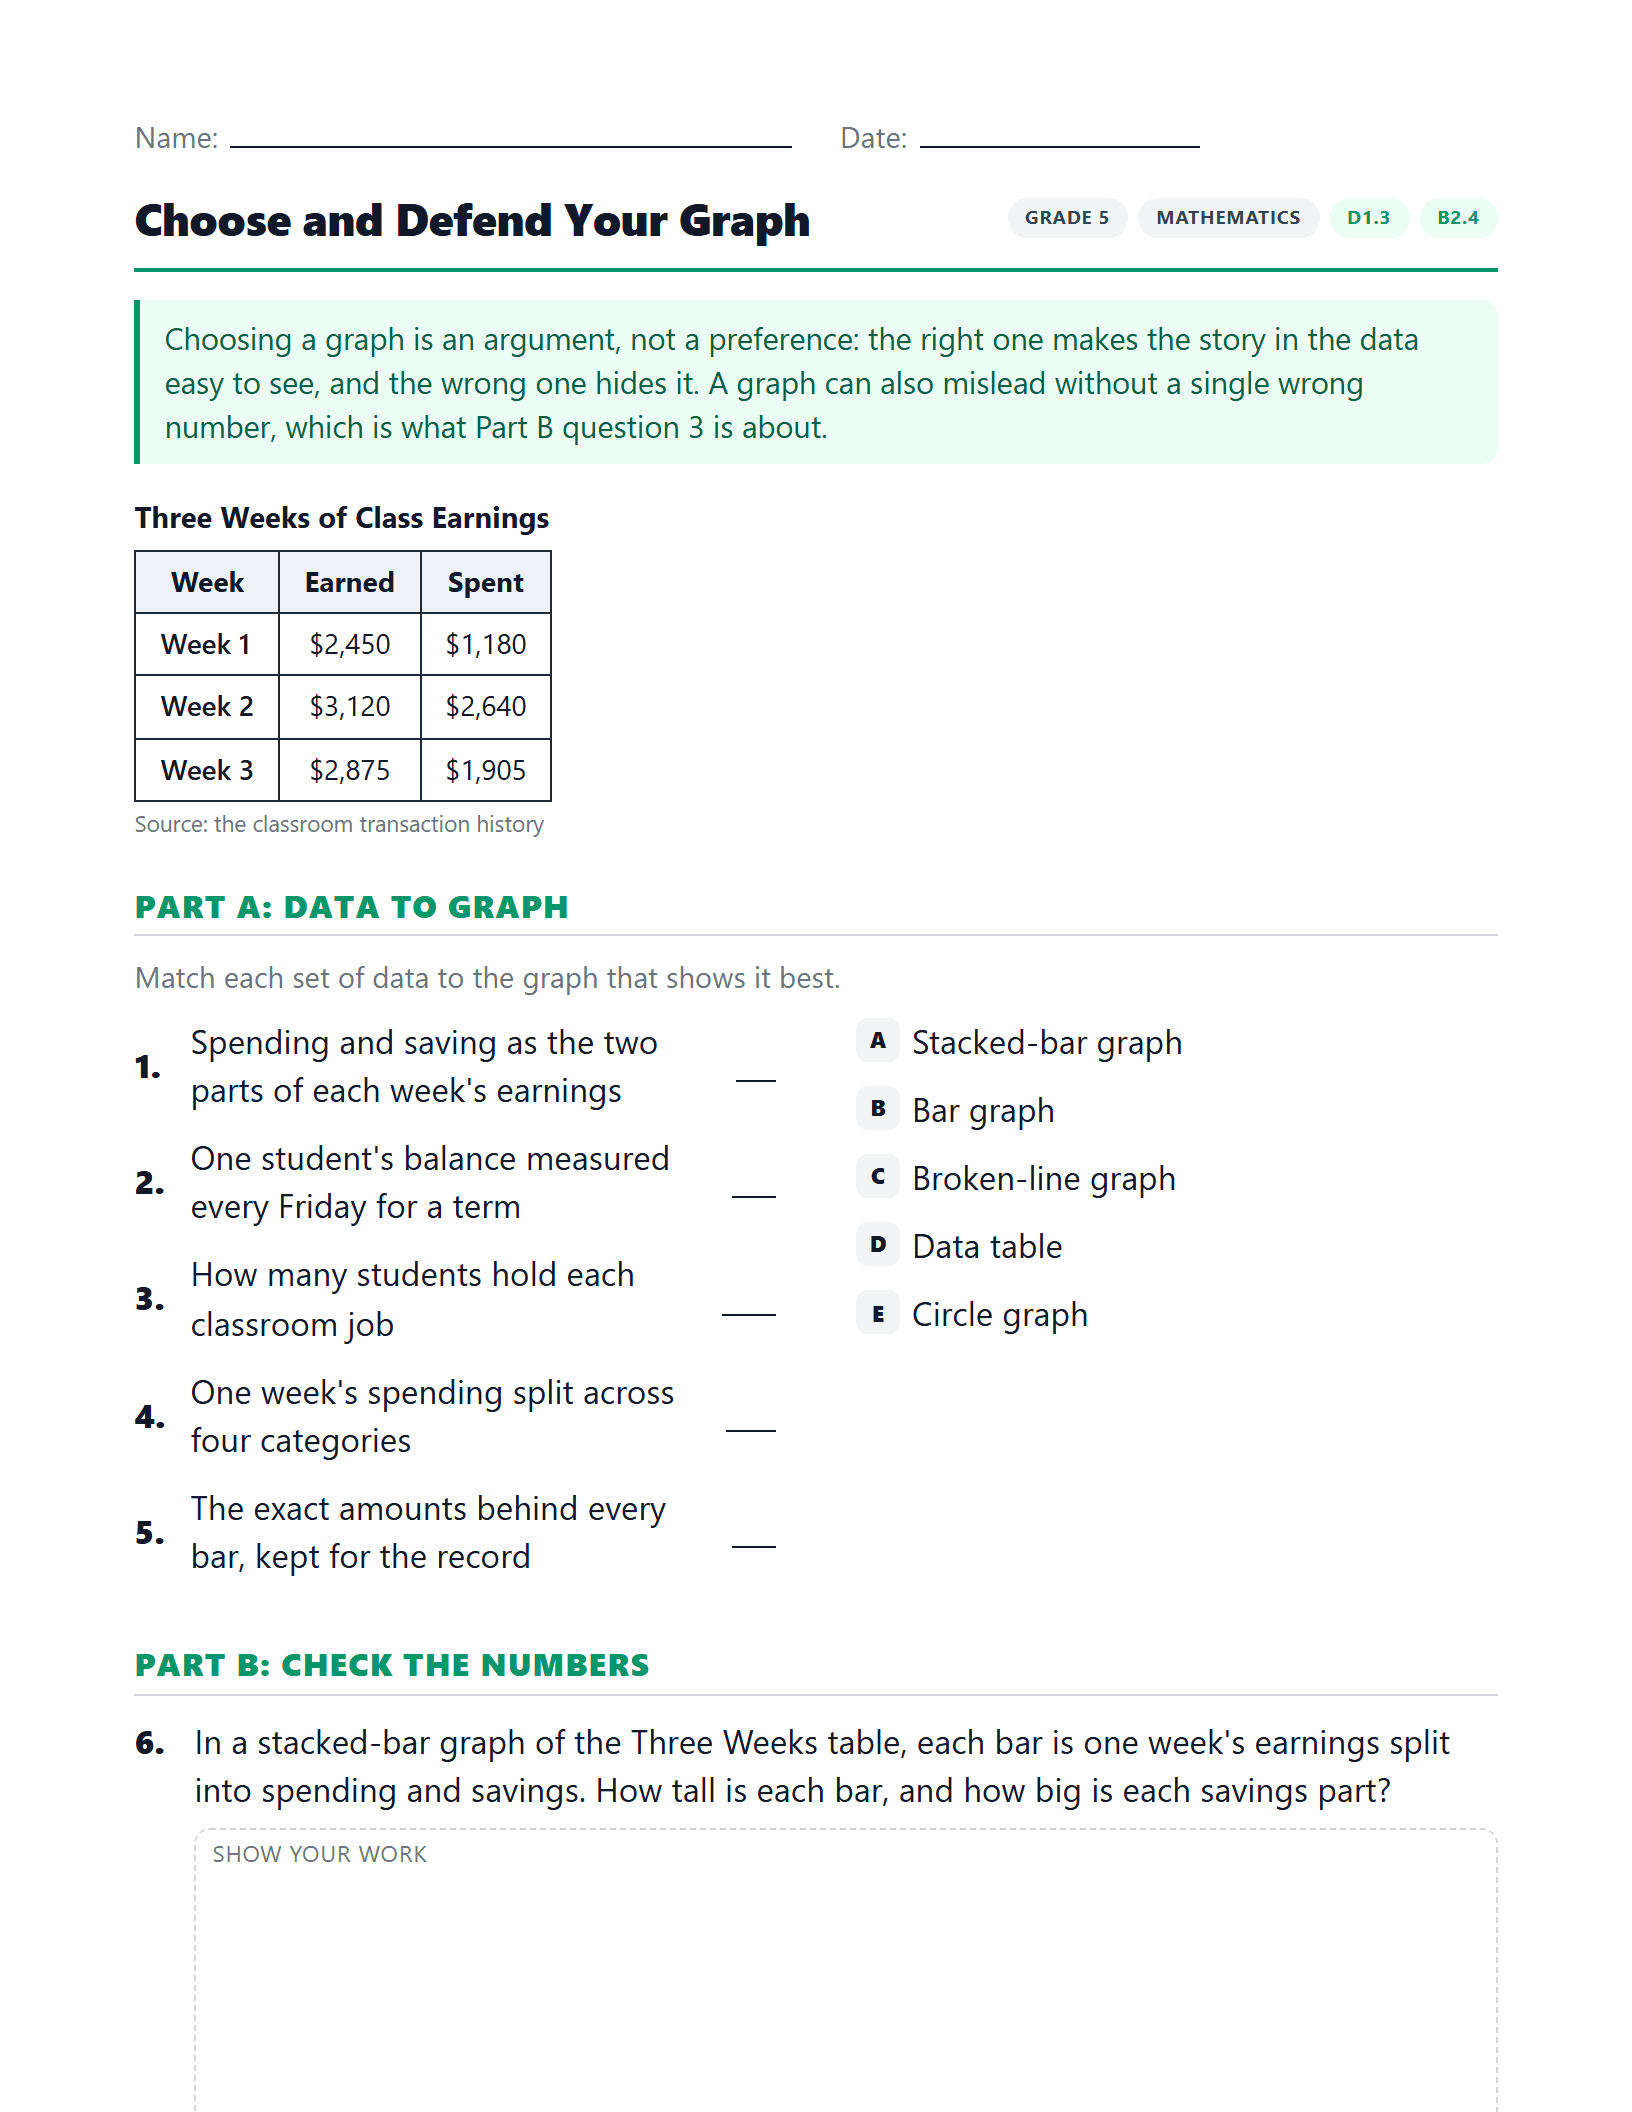
Choose and Defend Your Graph
Match five datasets to the graph that suits them, expose a misleading axis, and design one graph completely.
B2.6
3 worksheetsRepresent and solve problems involving the multiplication of two-digit whole numbers by two-digit whole numbers using the area model and using algorithms, and make connections between the two methods
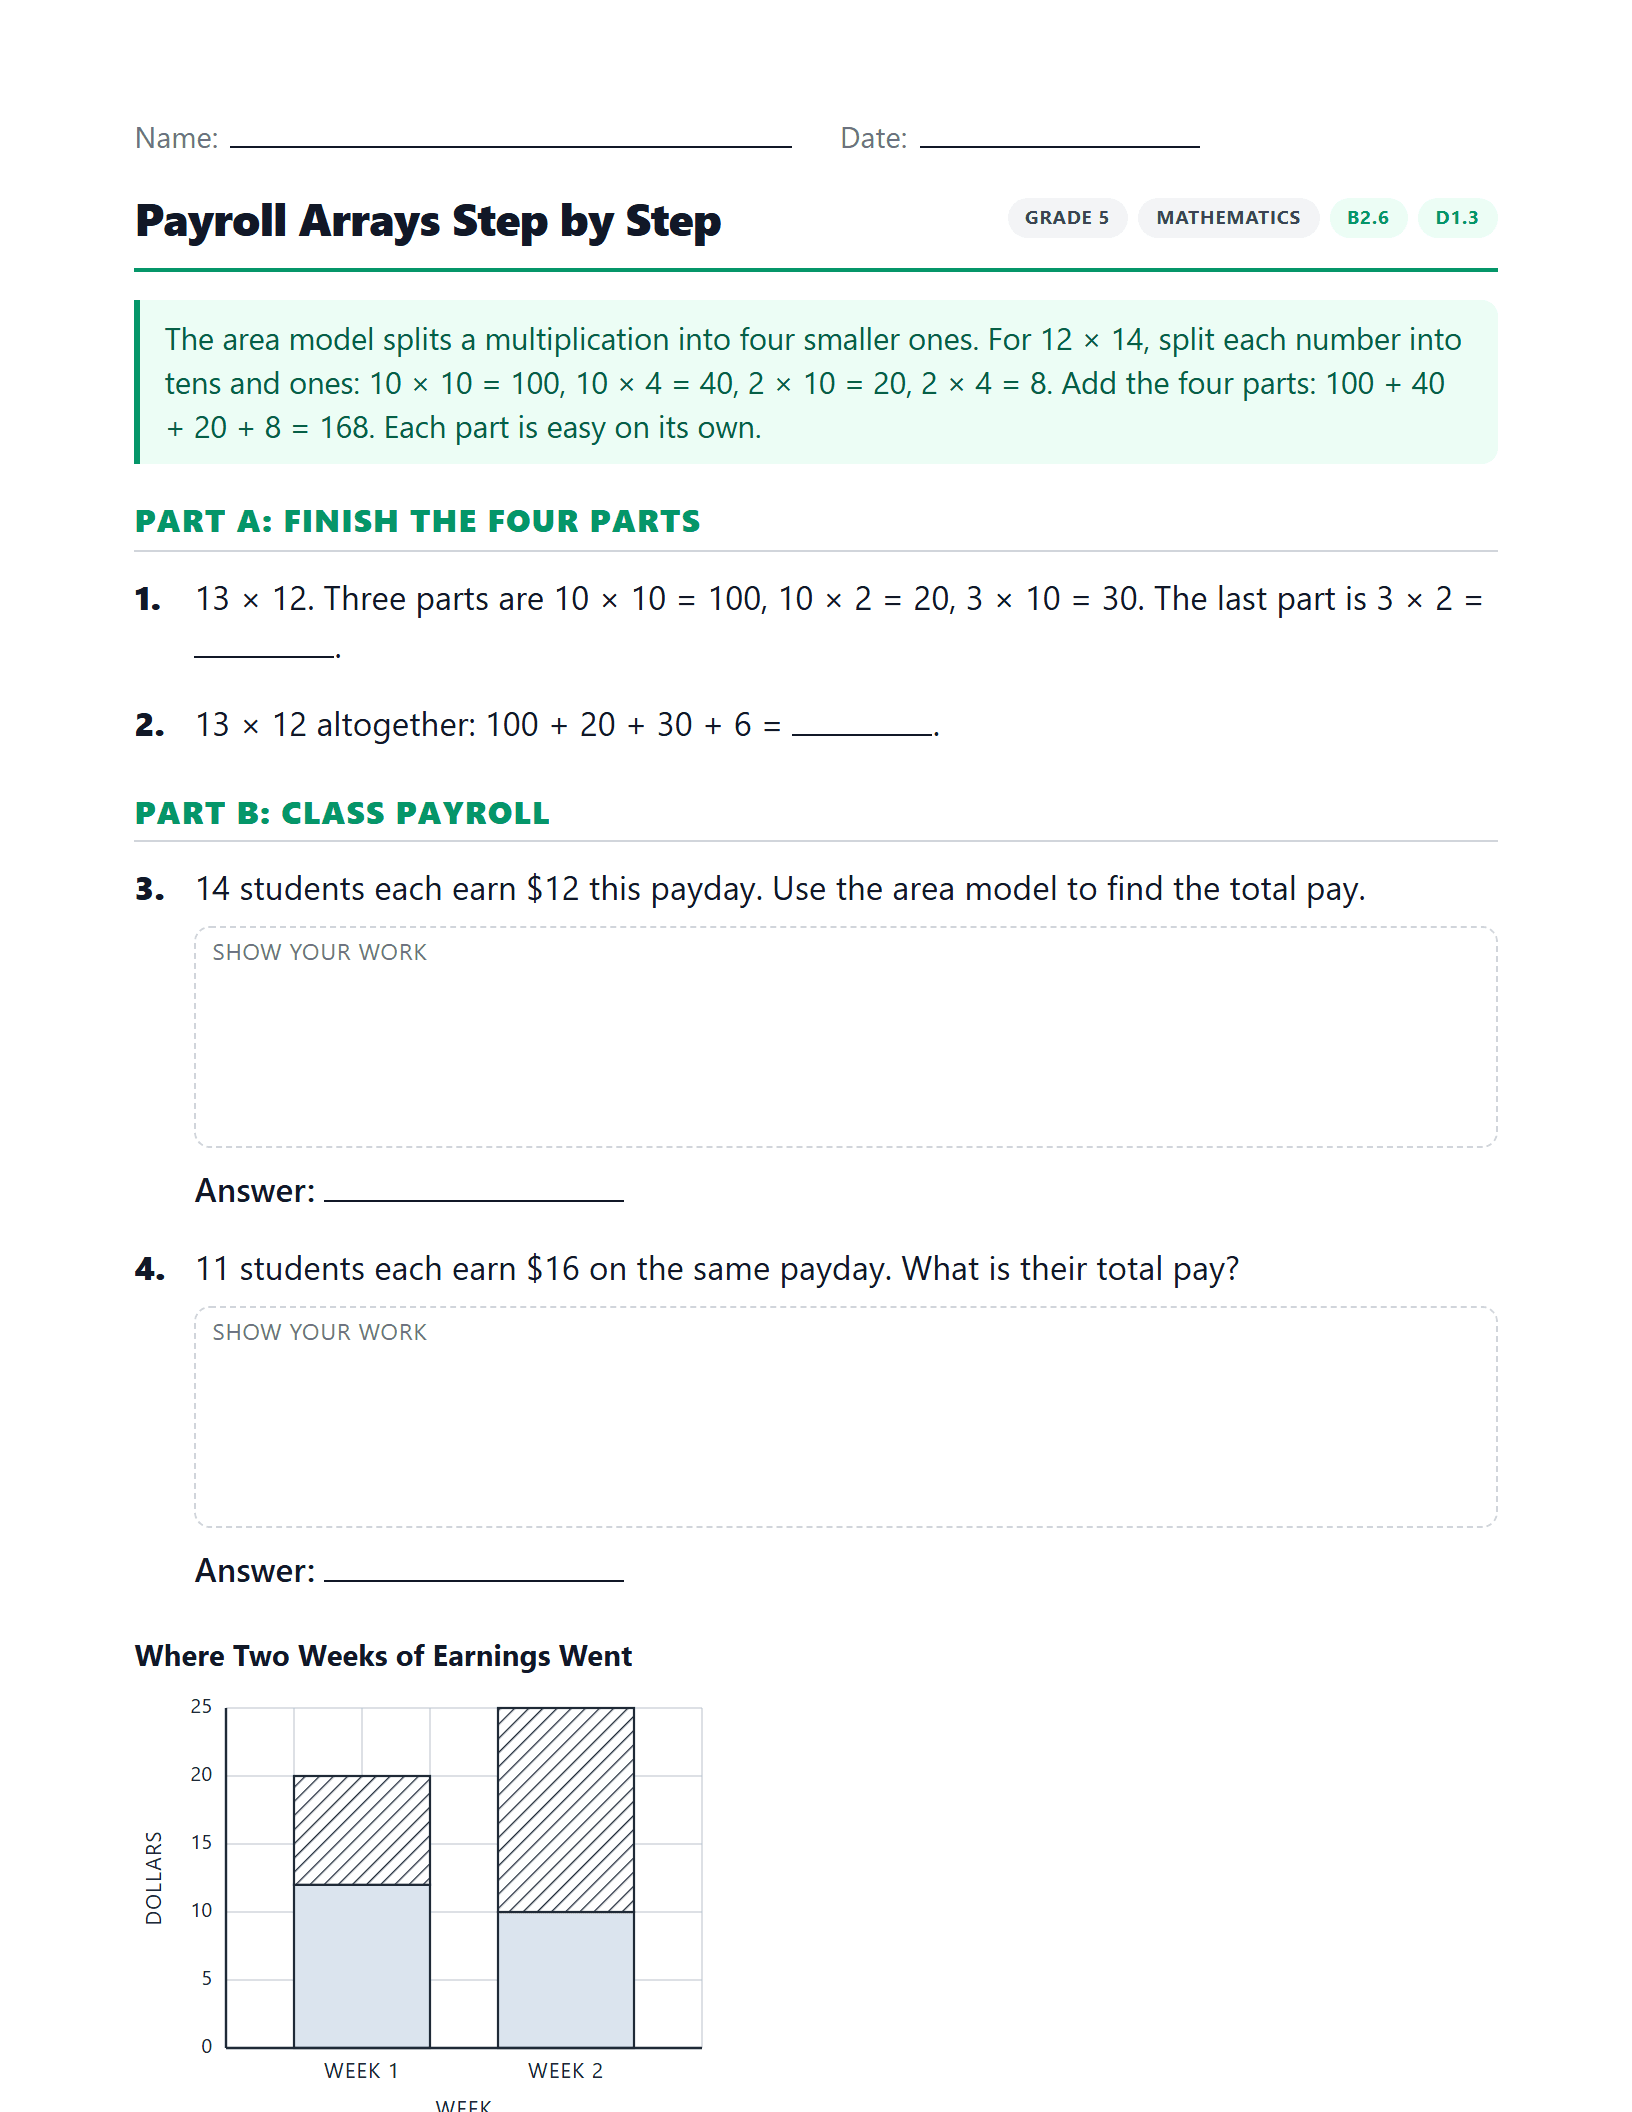
Payroll Arrays Step by Step
Work through the area model one part at a time to find a class payroll, then read and draw a stacked bar of spending and saving.
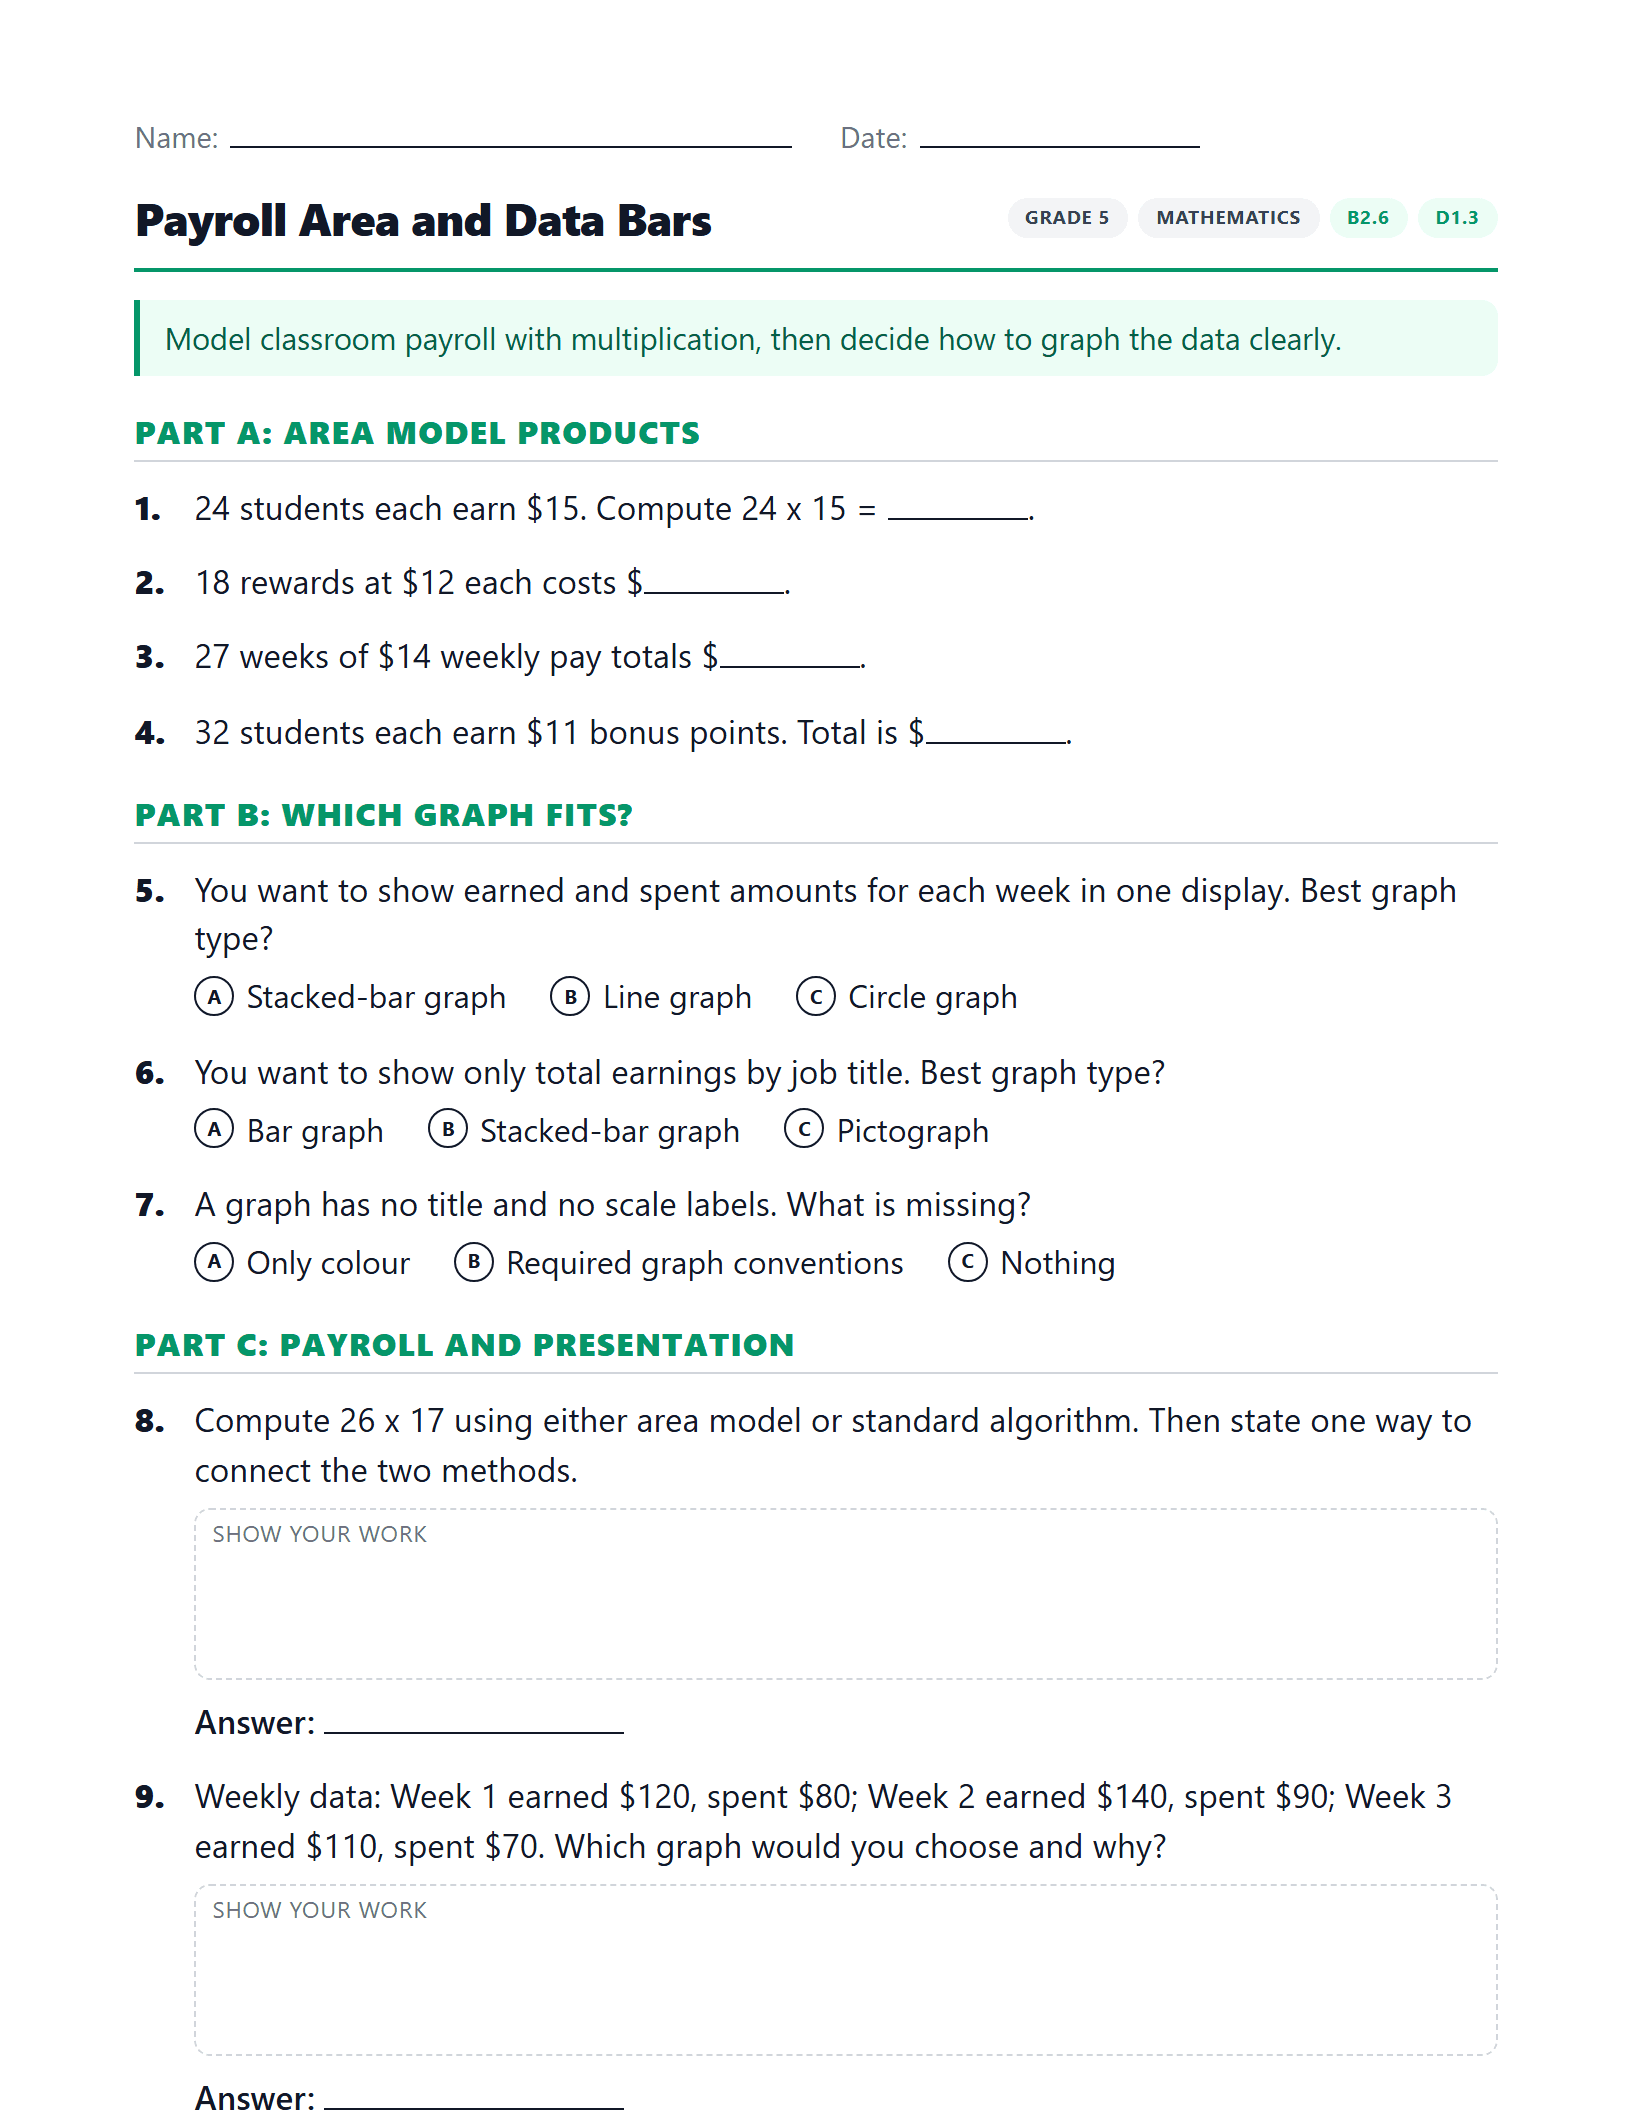
Payroll Area and Data Bars
Solve two-digit by two-digit payroll problems with the area model and the algorithm, then choose, draw and defend a graph of earning and spending.
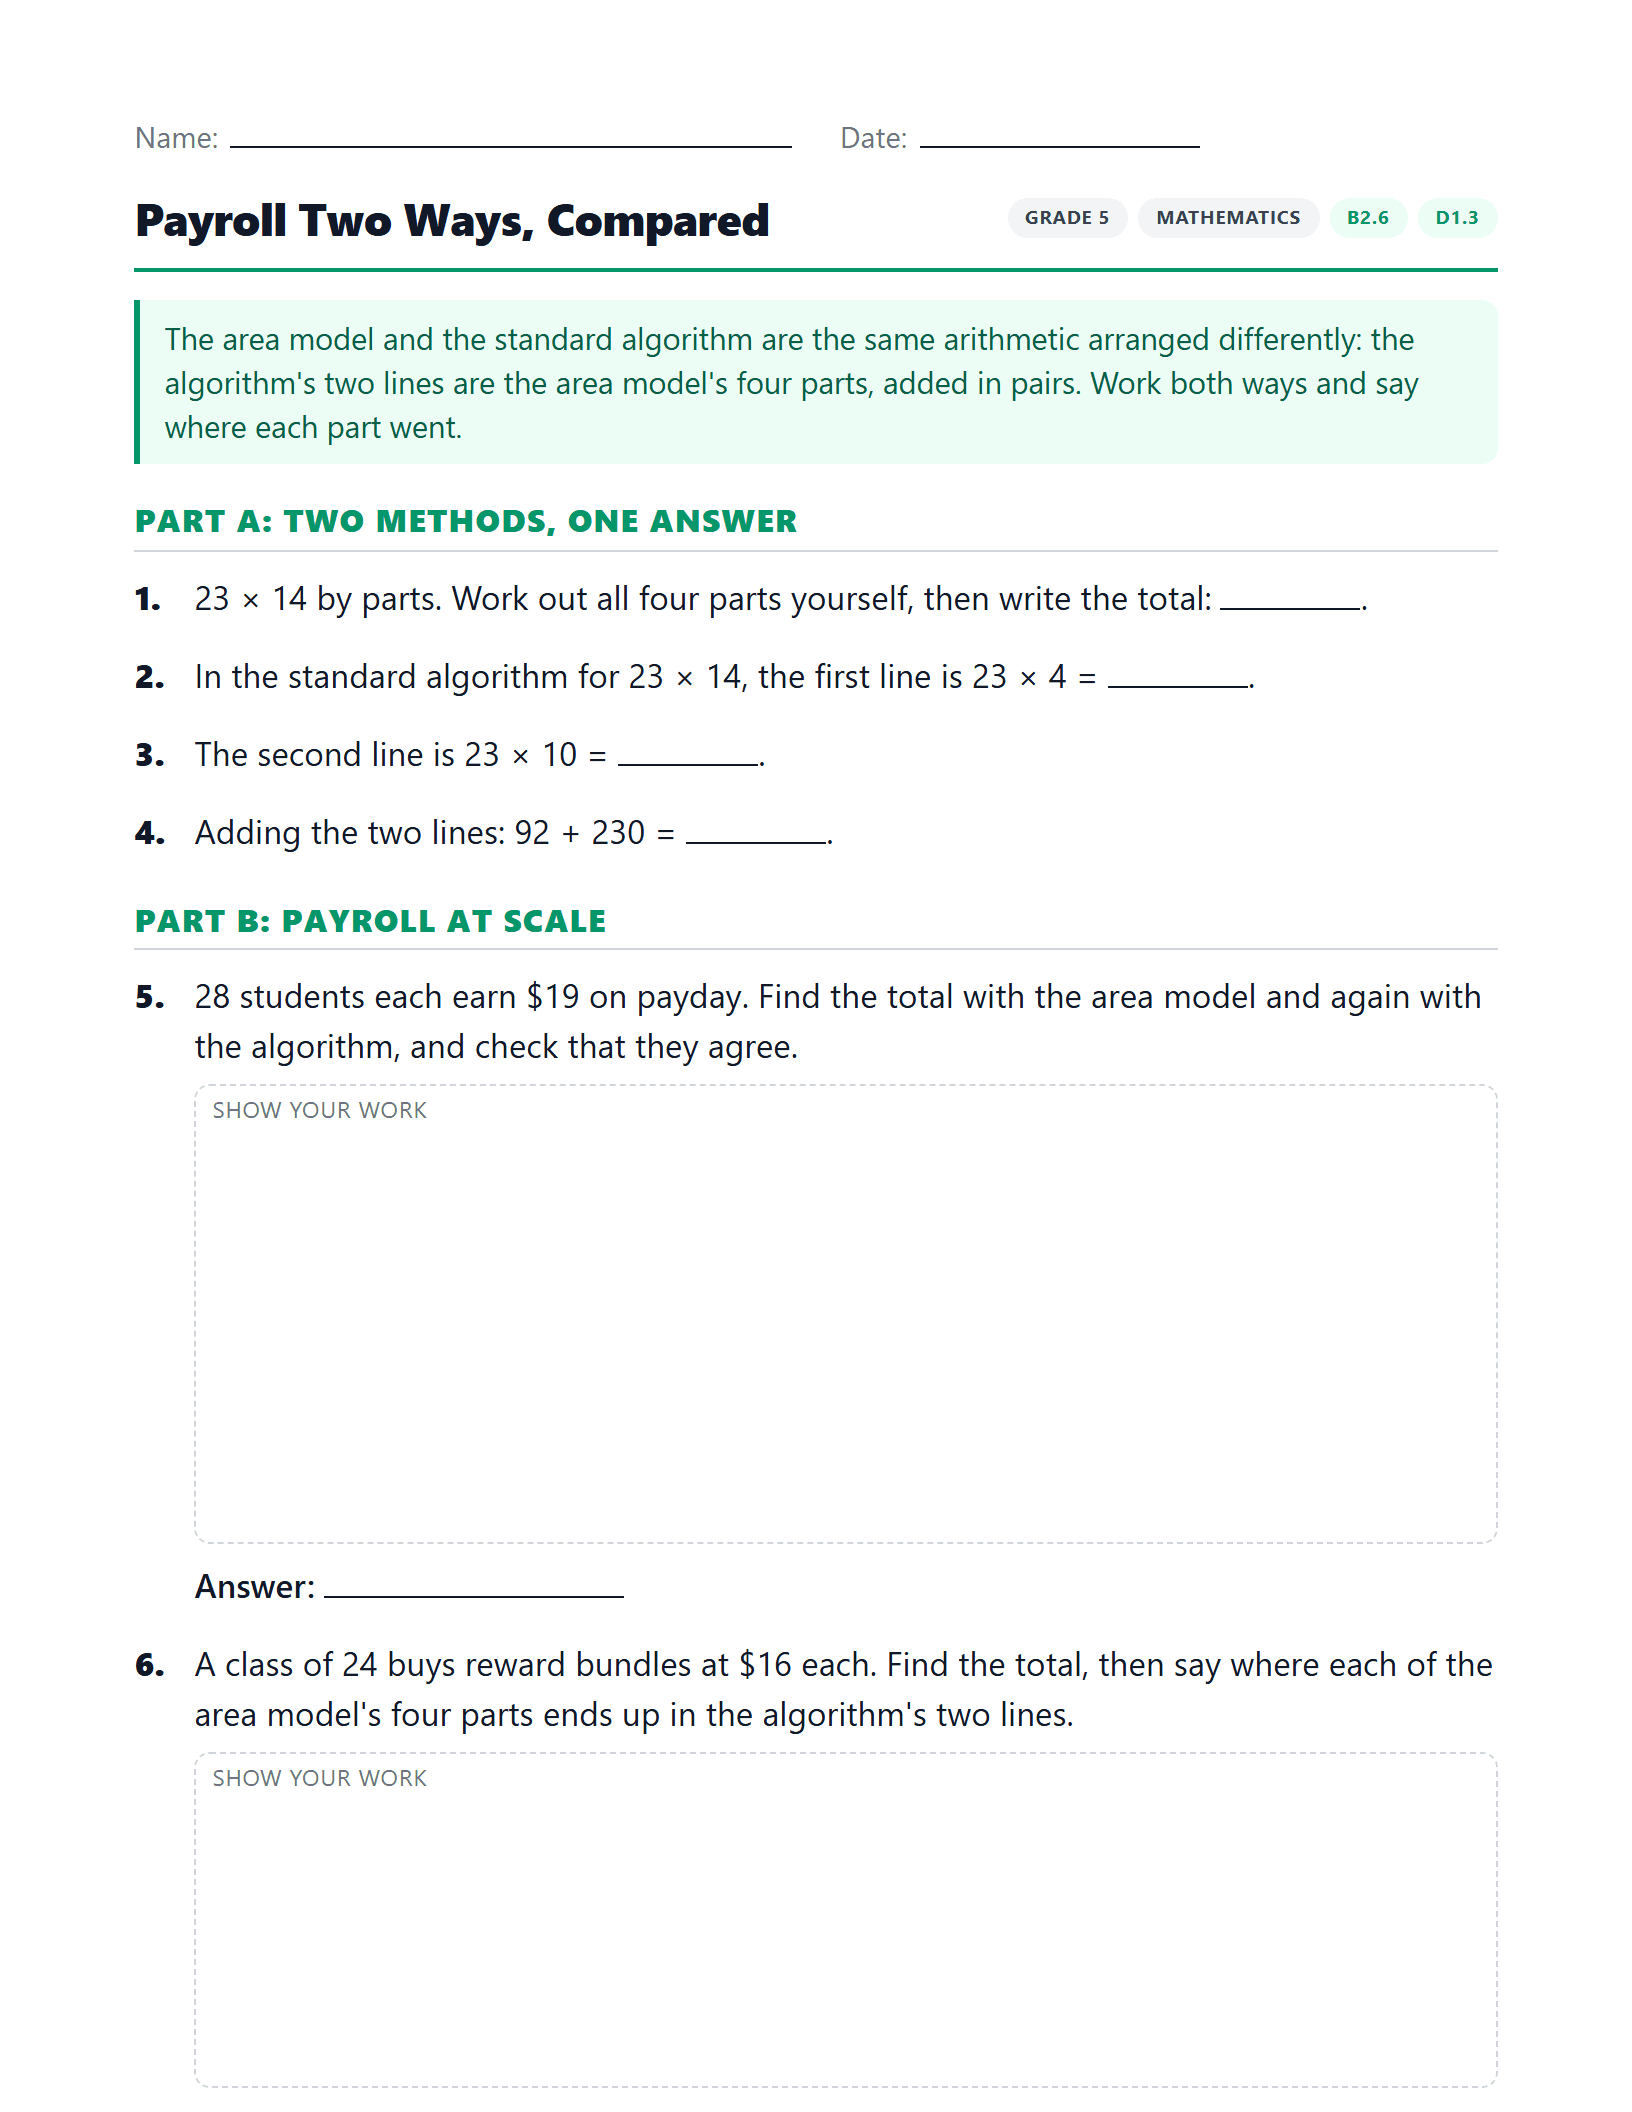
Payroll Two Ways, Compared
Match the area model's four parts to the algorithm's two lines, then draw and defend a stacked-bar graph with a scale that fits.
F1.2
3 worksheetsEstimate and calculate the cost of transactions involving multiple items priced in dollars and cents, including sales tax, using various strategies
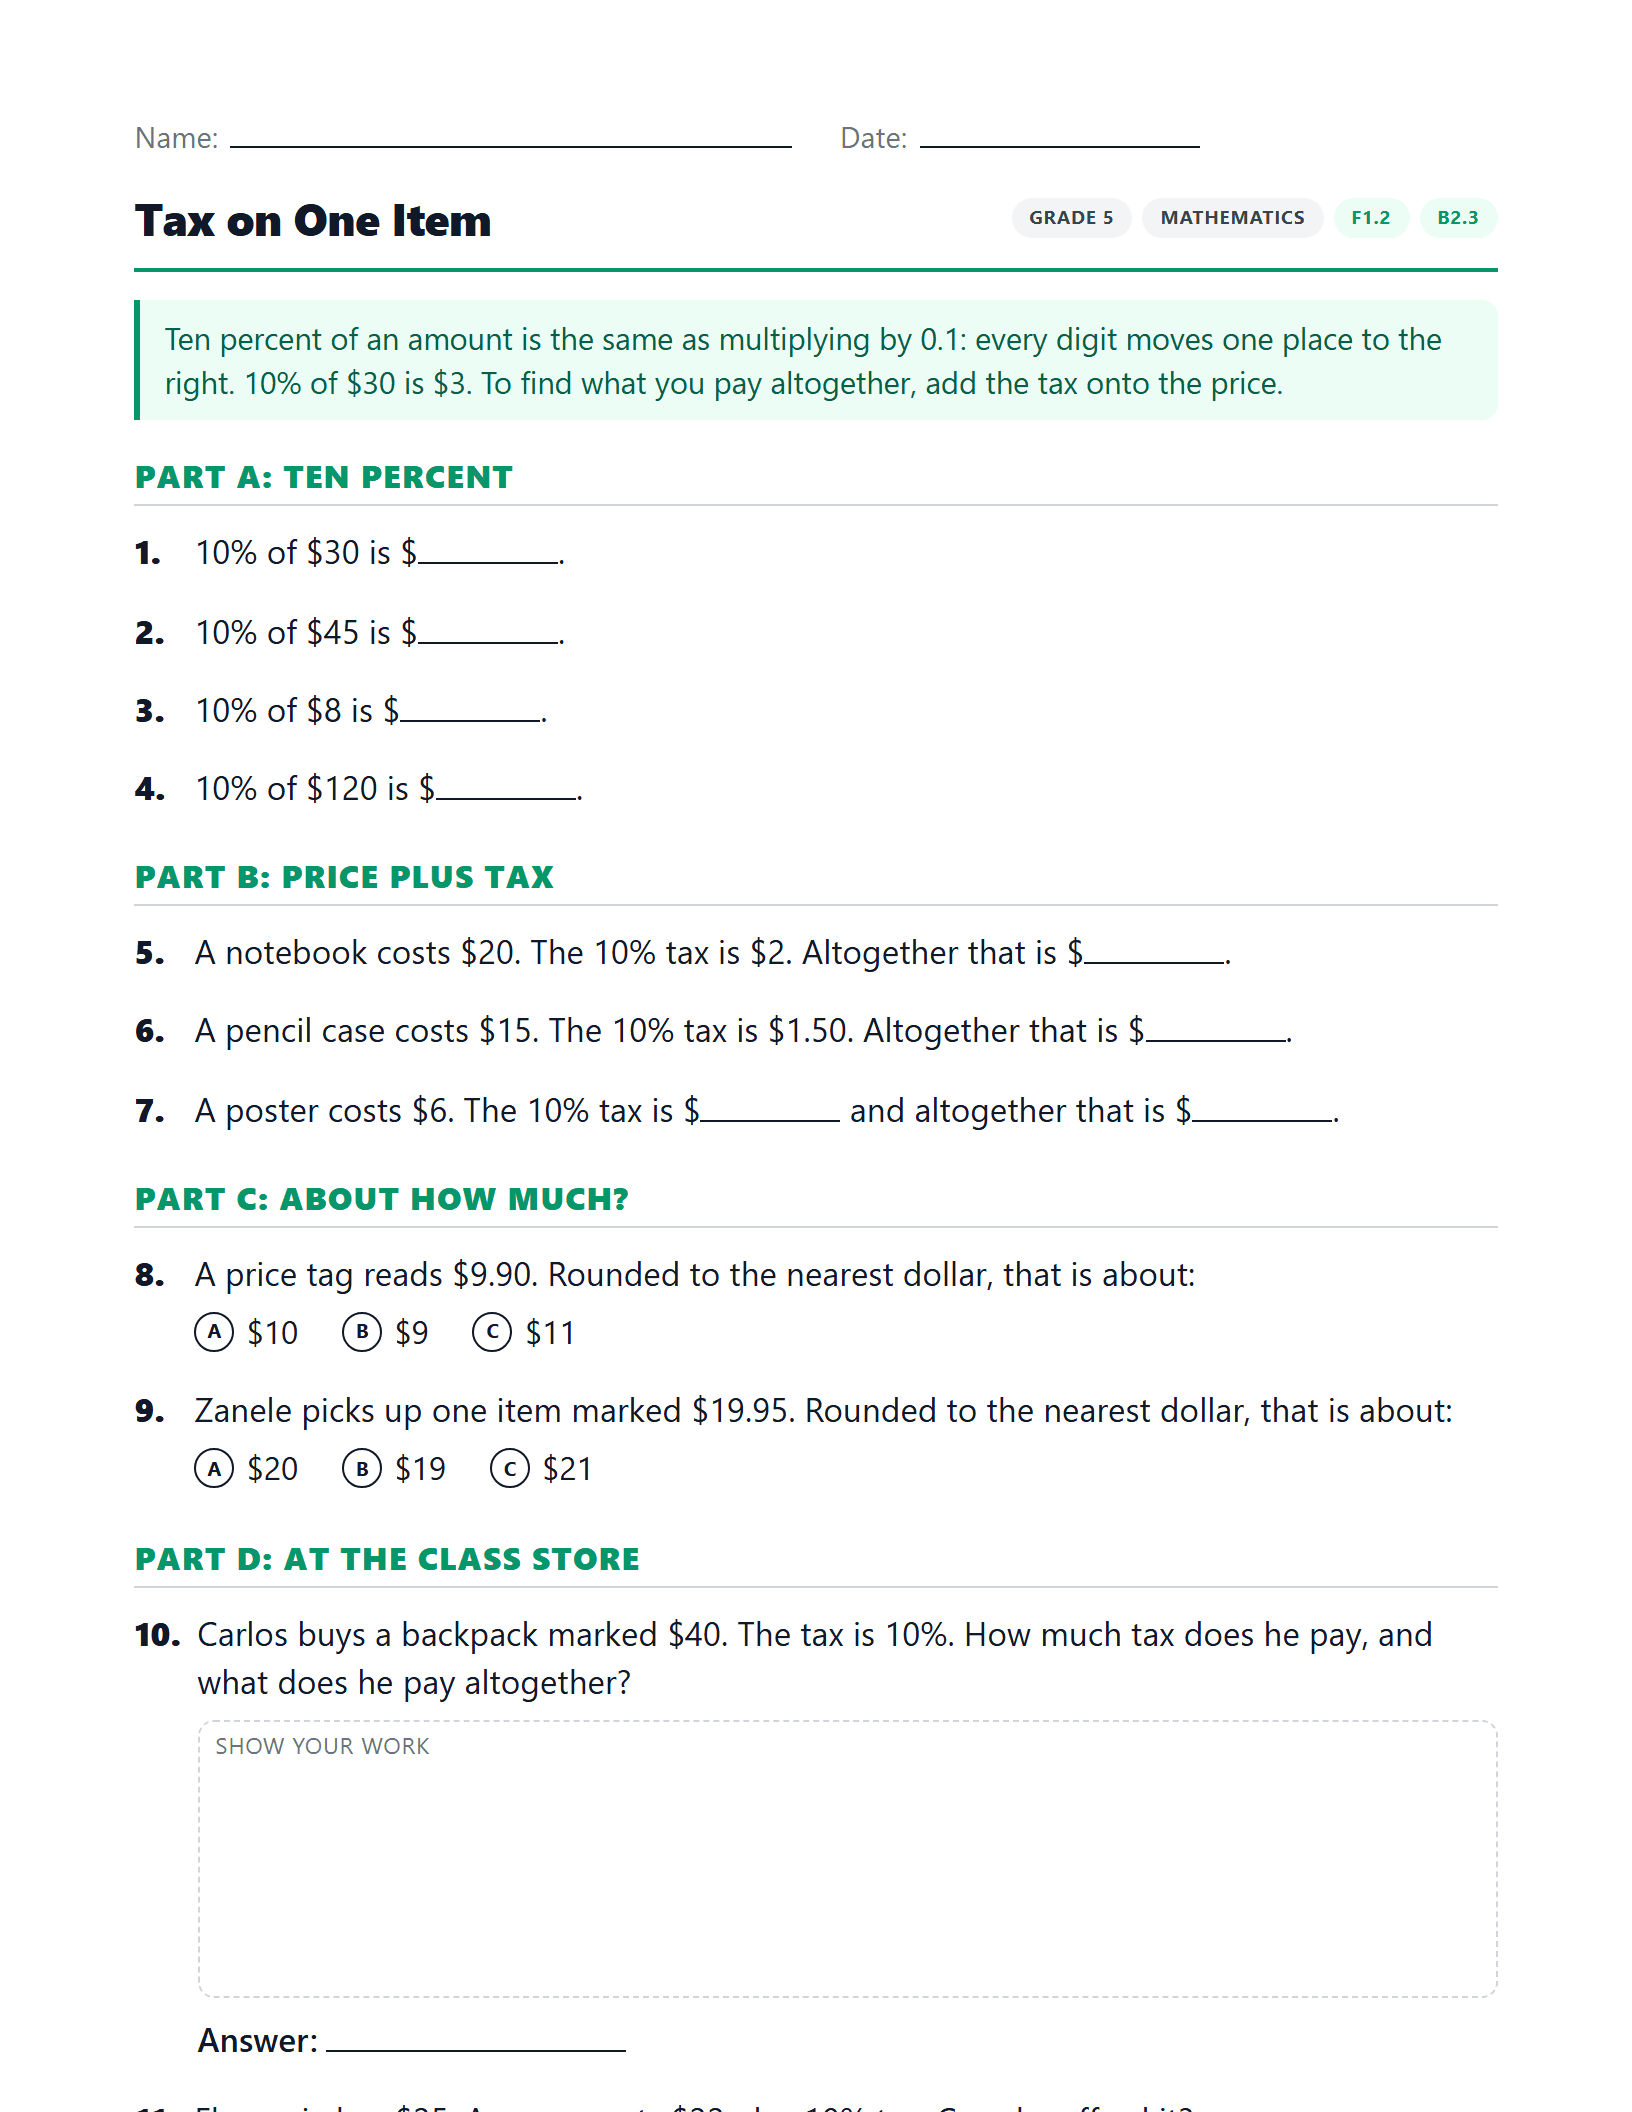
Tax on One Item
Find 10% tax on a single purchase and add it on, one step at a time.
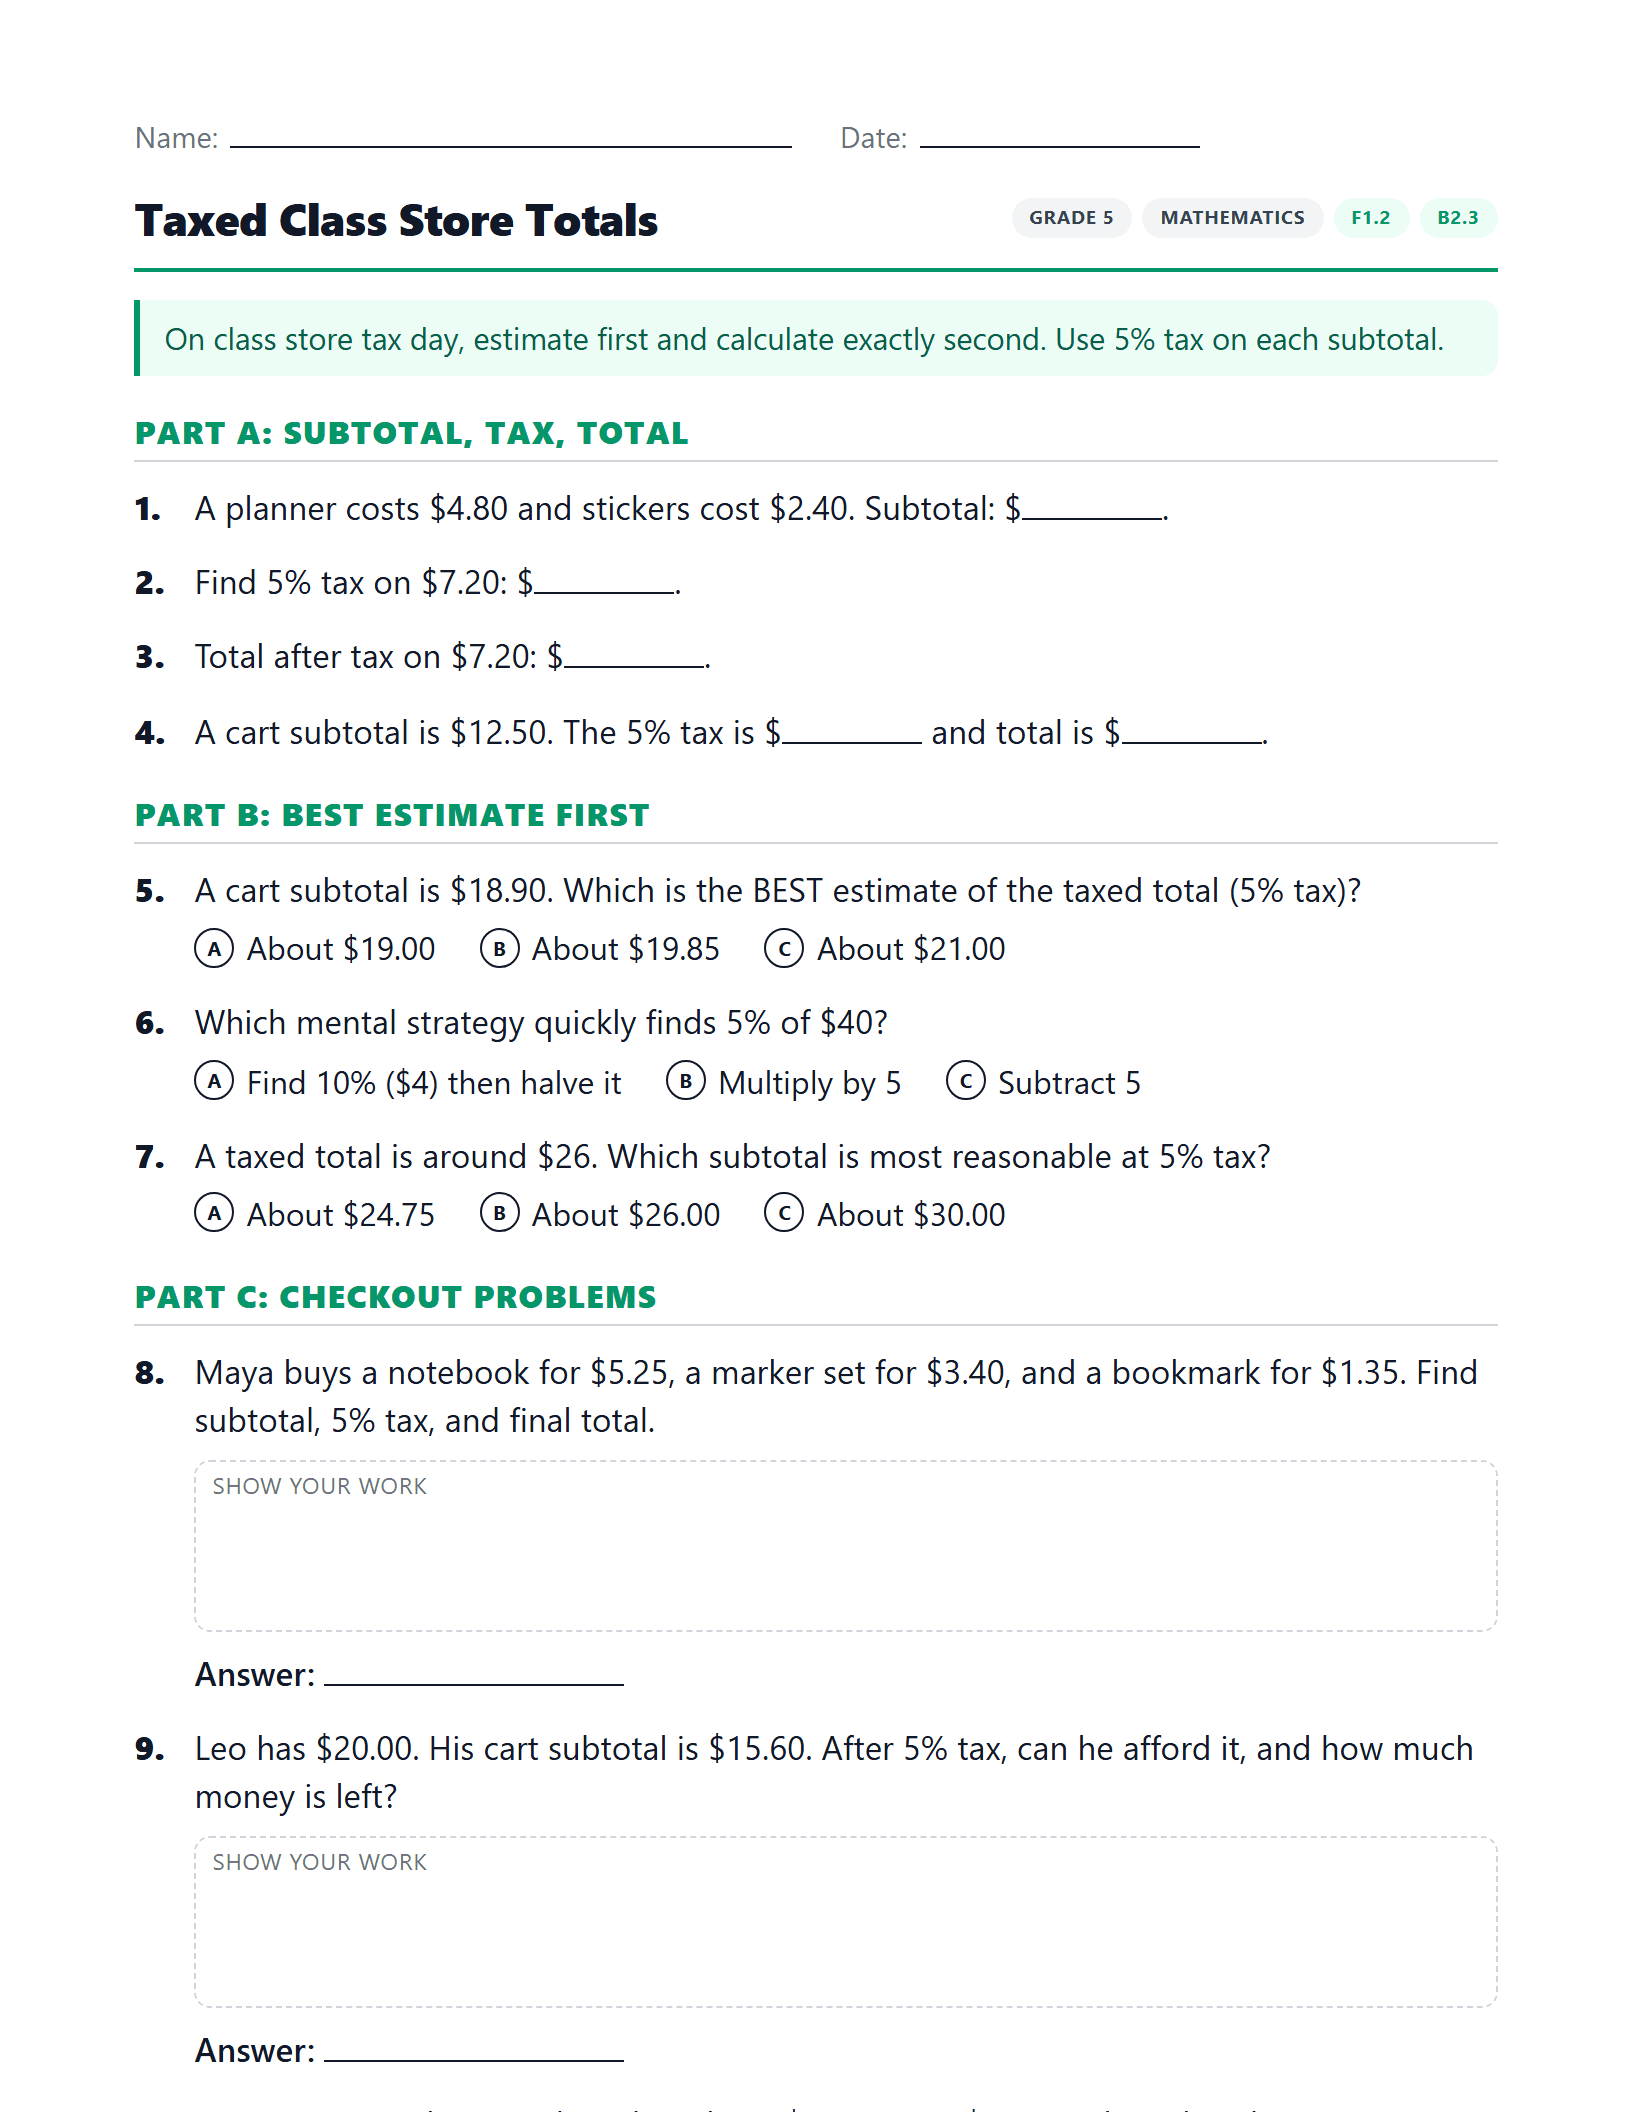
Taxed Class Store Totals
Estimate and calculate class store totals with dollars and cents, including 5% sales tax.
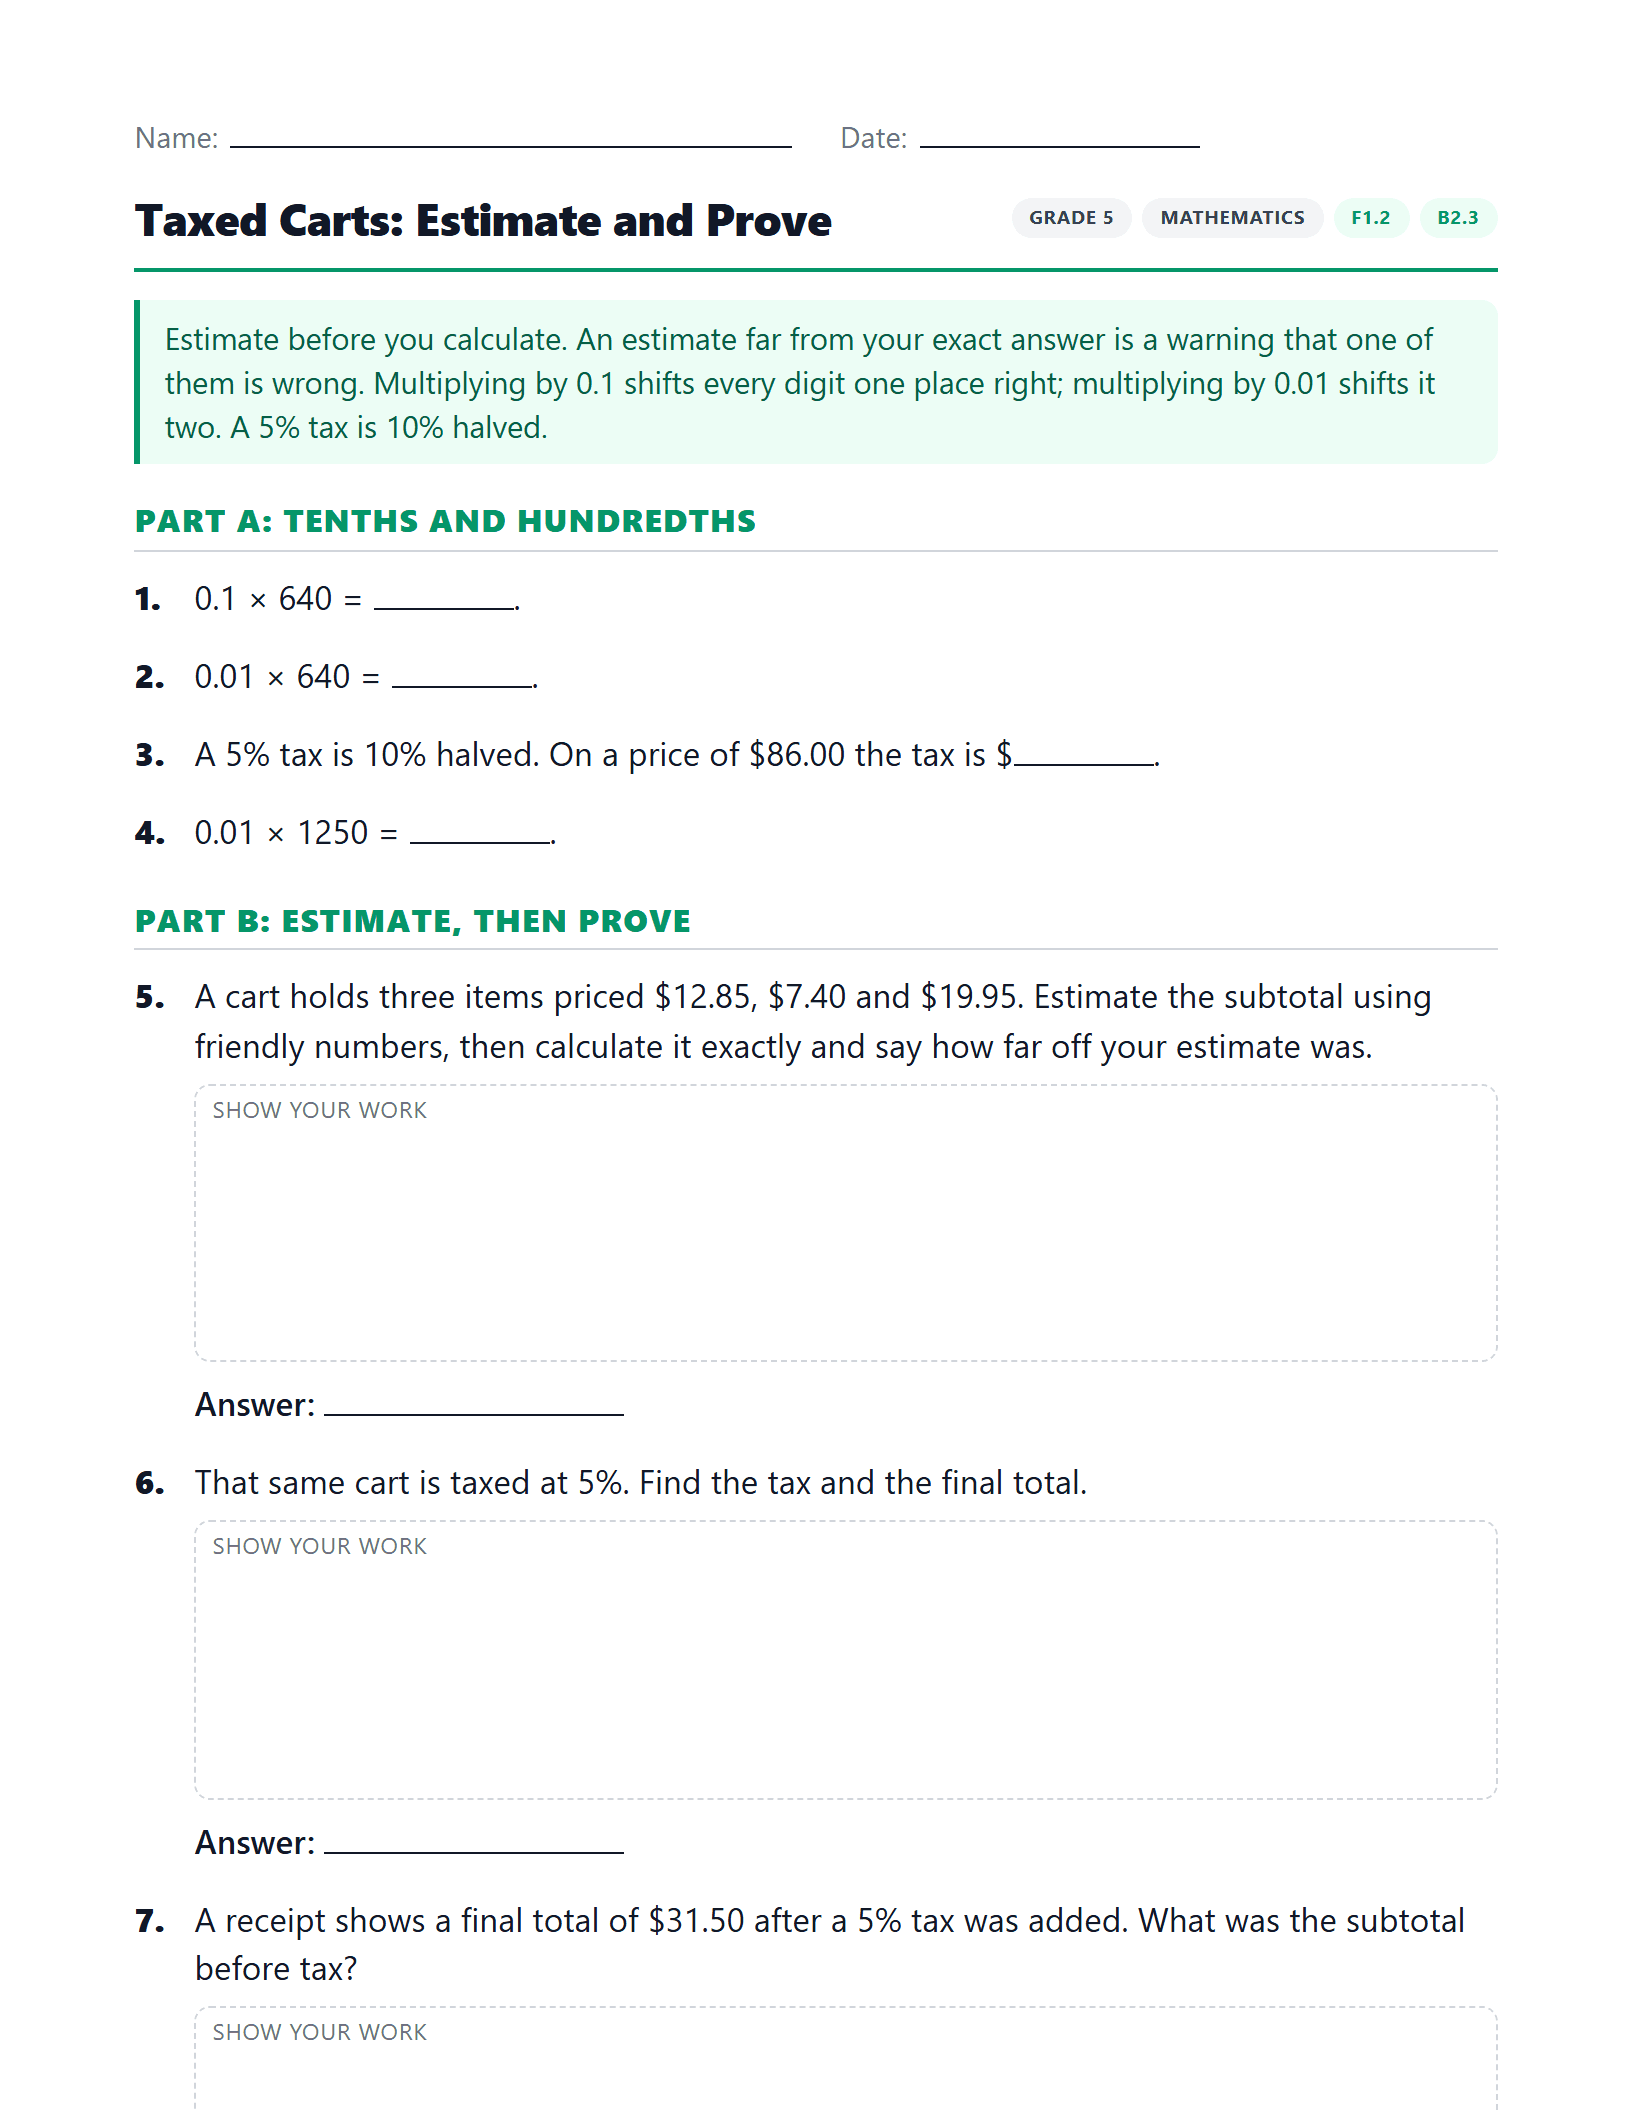
Taxed Carts: Estimate and Prove
Estimate a taxed cart, compute it exactly, work backwards from a receipt, and judge whether two orders of operation agree.
Want the teaching ideas behind these sheets?
See how each Grade 5 expectation connects to your classroom economy, with activity ideas for every one.