Grade 7 Ontario Worksheets
12 free printable sheets across 4 expectations, each written at up to three levels — Modified for reduced expectations, Standard for the expectation as written, and Challenge to extend beyond it — so one expectation covers the whole class. Every sheet includes a full answer key on the last page.
B2.3
3 worksheetsUse mental math strategies to increase and decrease a whole number by 1%, 5%, 10%, 25%, 50%, and 100%, and explain the strategies used
Increase and Decrease
Find a benchmark percent of an amount, then add it on or take it off.
Benchmark Increase, Benchmark Decrease
Build any percent from 1%, 5% and 10%, apply changes in both directions, and work out what percent a change really was.
Percent Change Both Ways
Work backwards from a changed amount to the original, compare percent changes on different starting points, and find the single discount that matches two.
D1.3
3 worksheetsSelect from among a variety of graphs, including circle graphs, the type of graph best suited to represent various sets of data; display the data in the graphs with proper sources, titles, and labels, and appropriate scales; and justify their choice of graphs
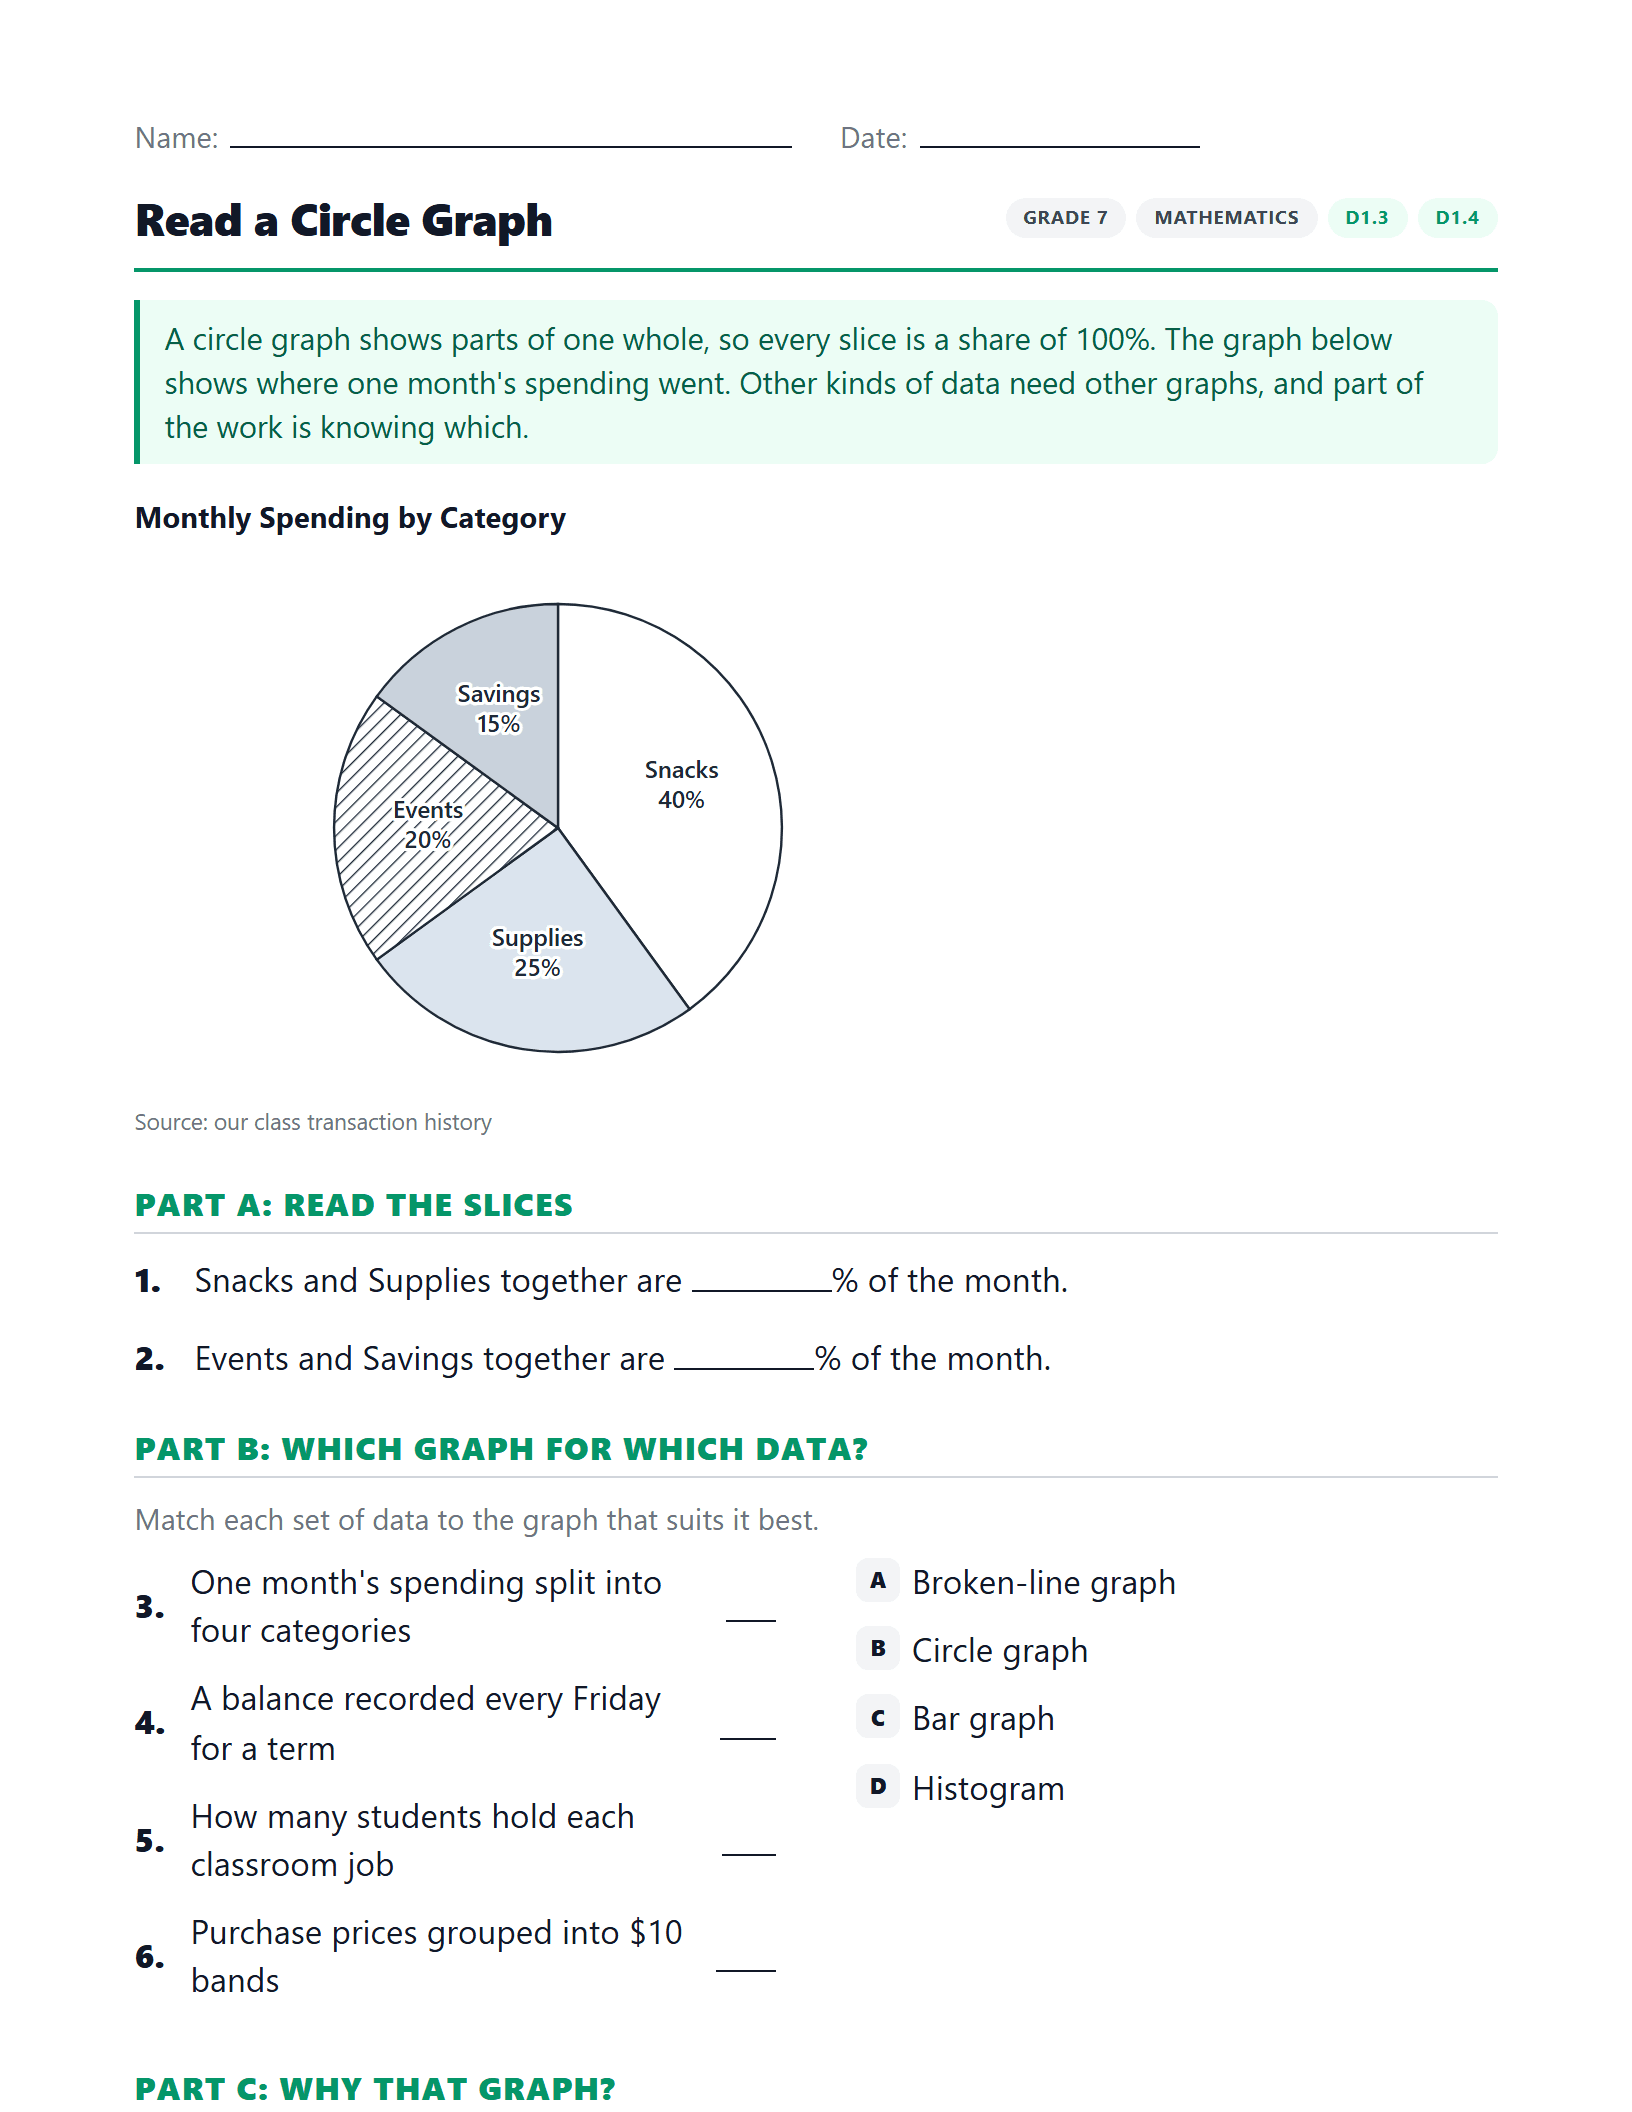
Read a Circle Graph
Read a circle graph of one month's spending, choose the right graph for other data, and build next month's circle graph on a percent circle.
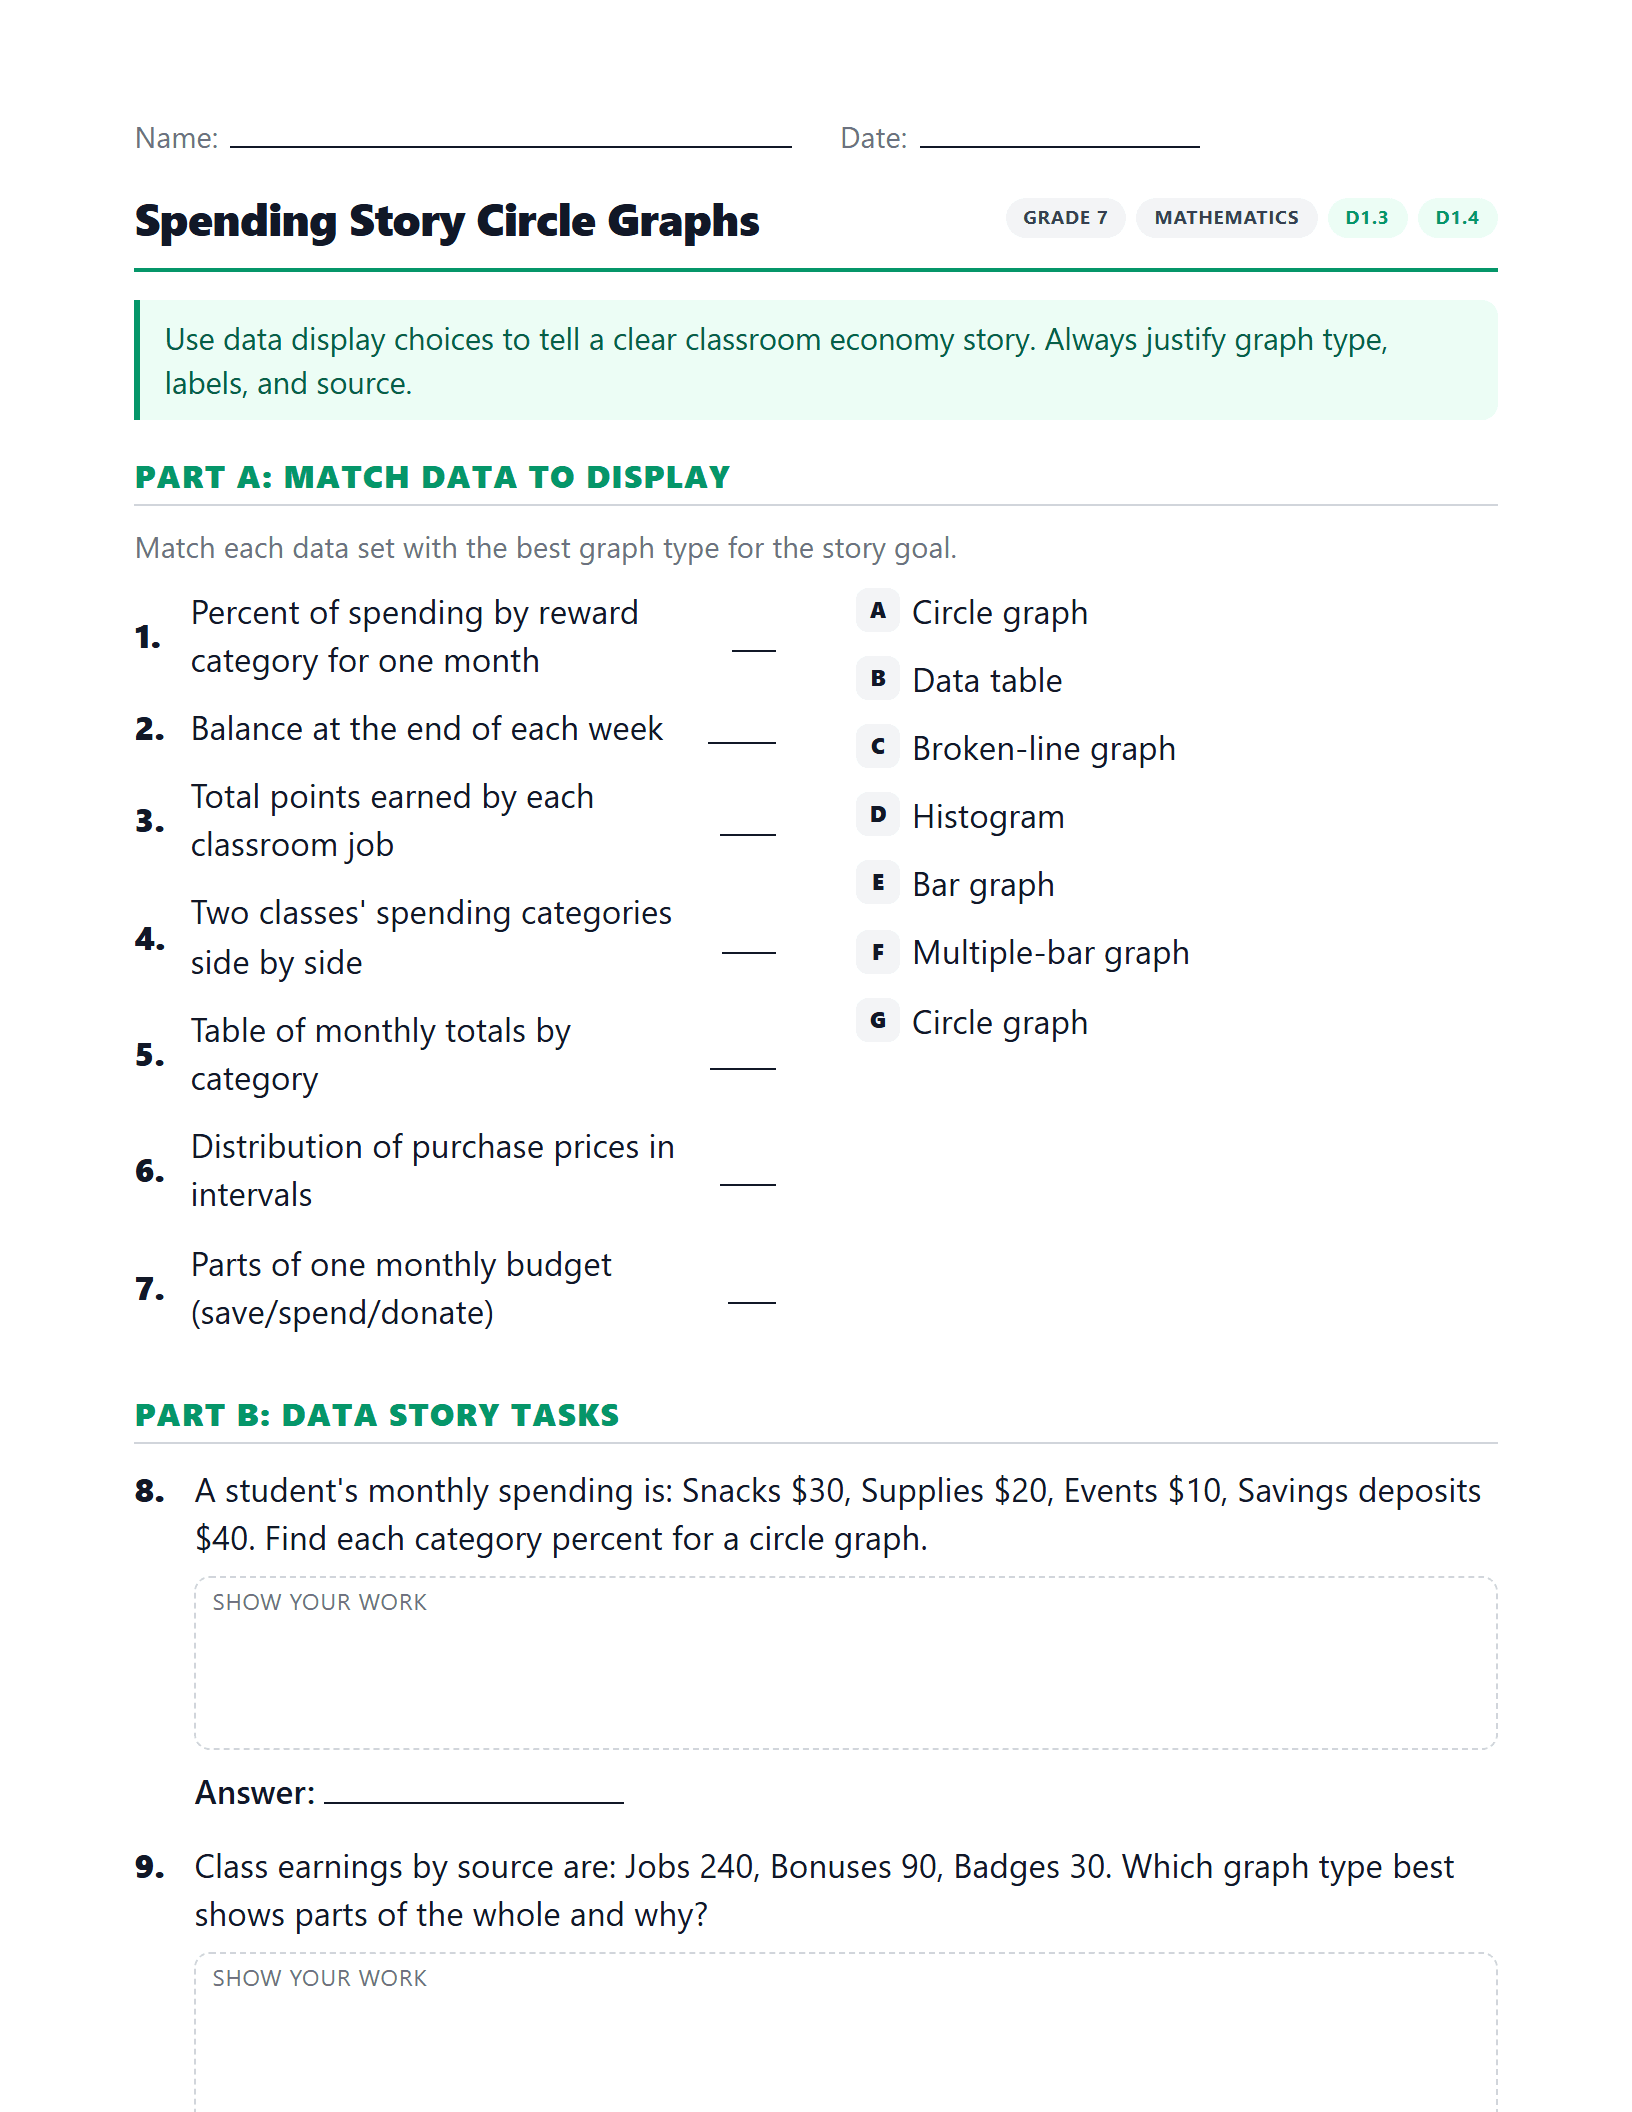
Spending Story Circle Graphs
Work out percents and slice angles from a spending table, choose the right graph for other data, and build a circle-graph infographic.
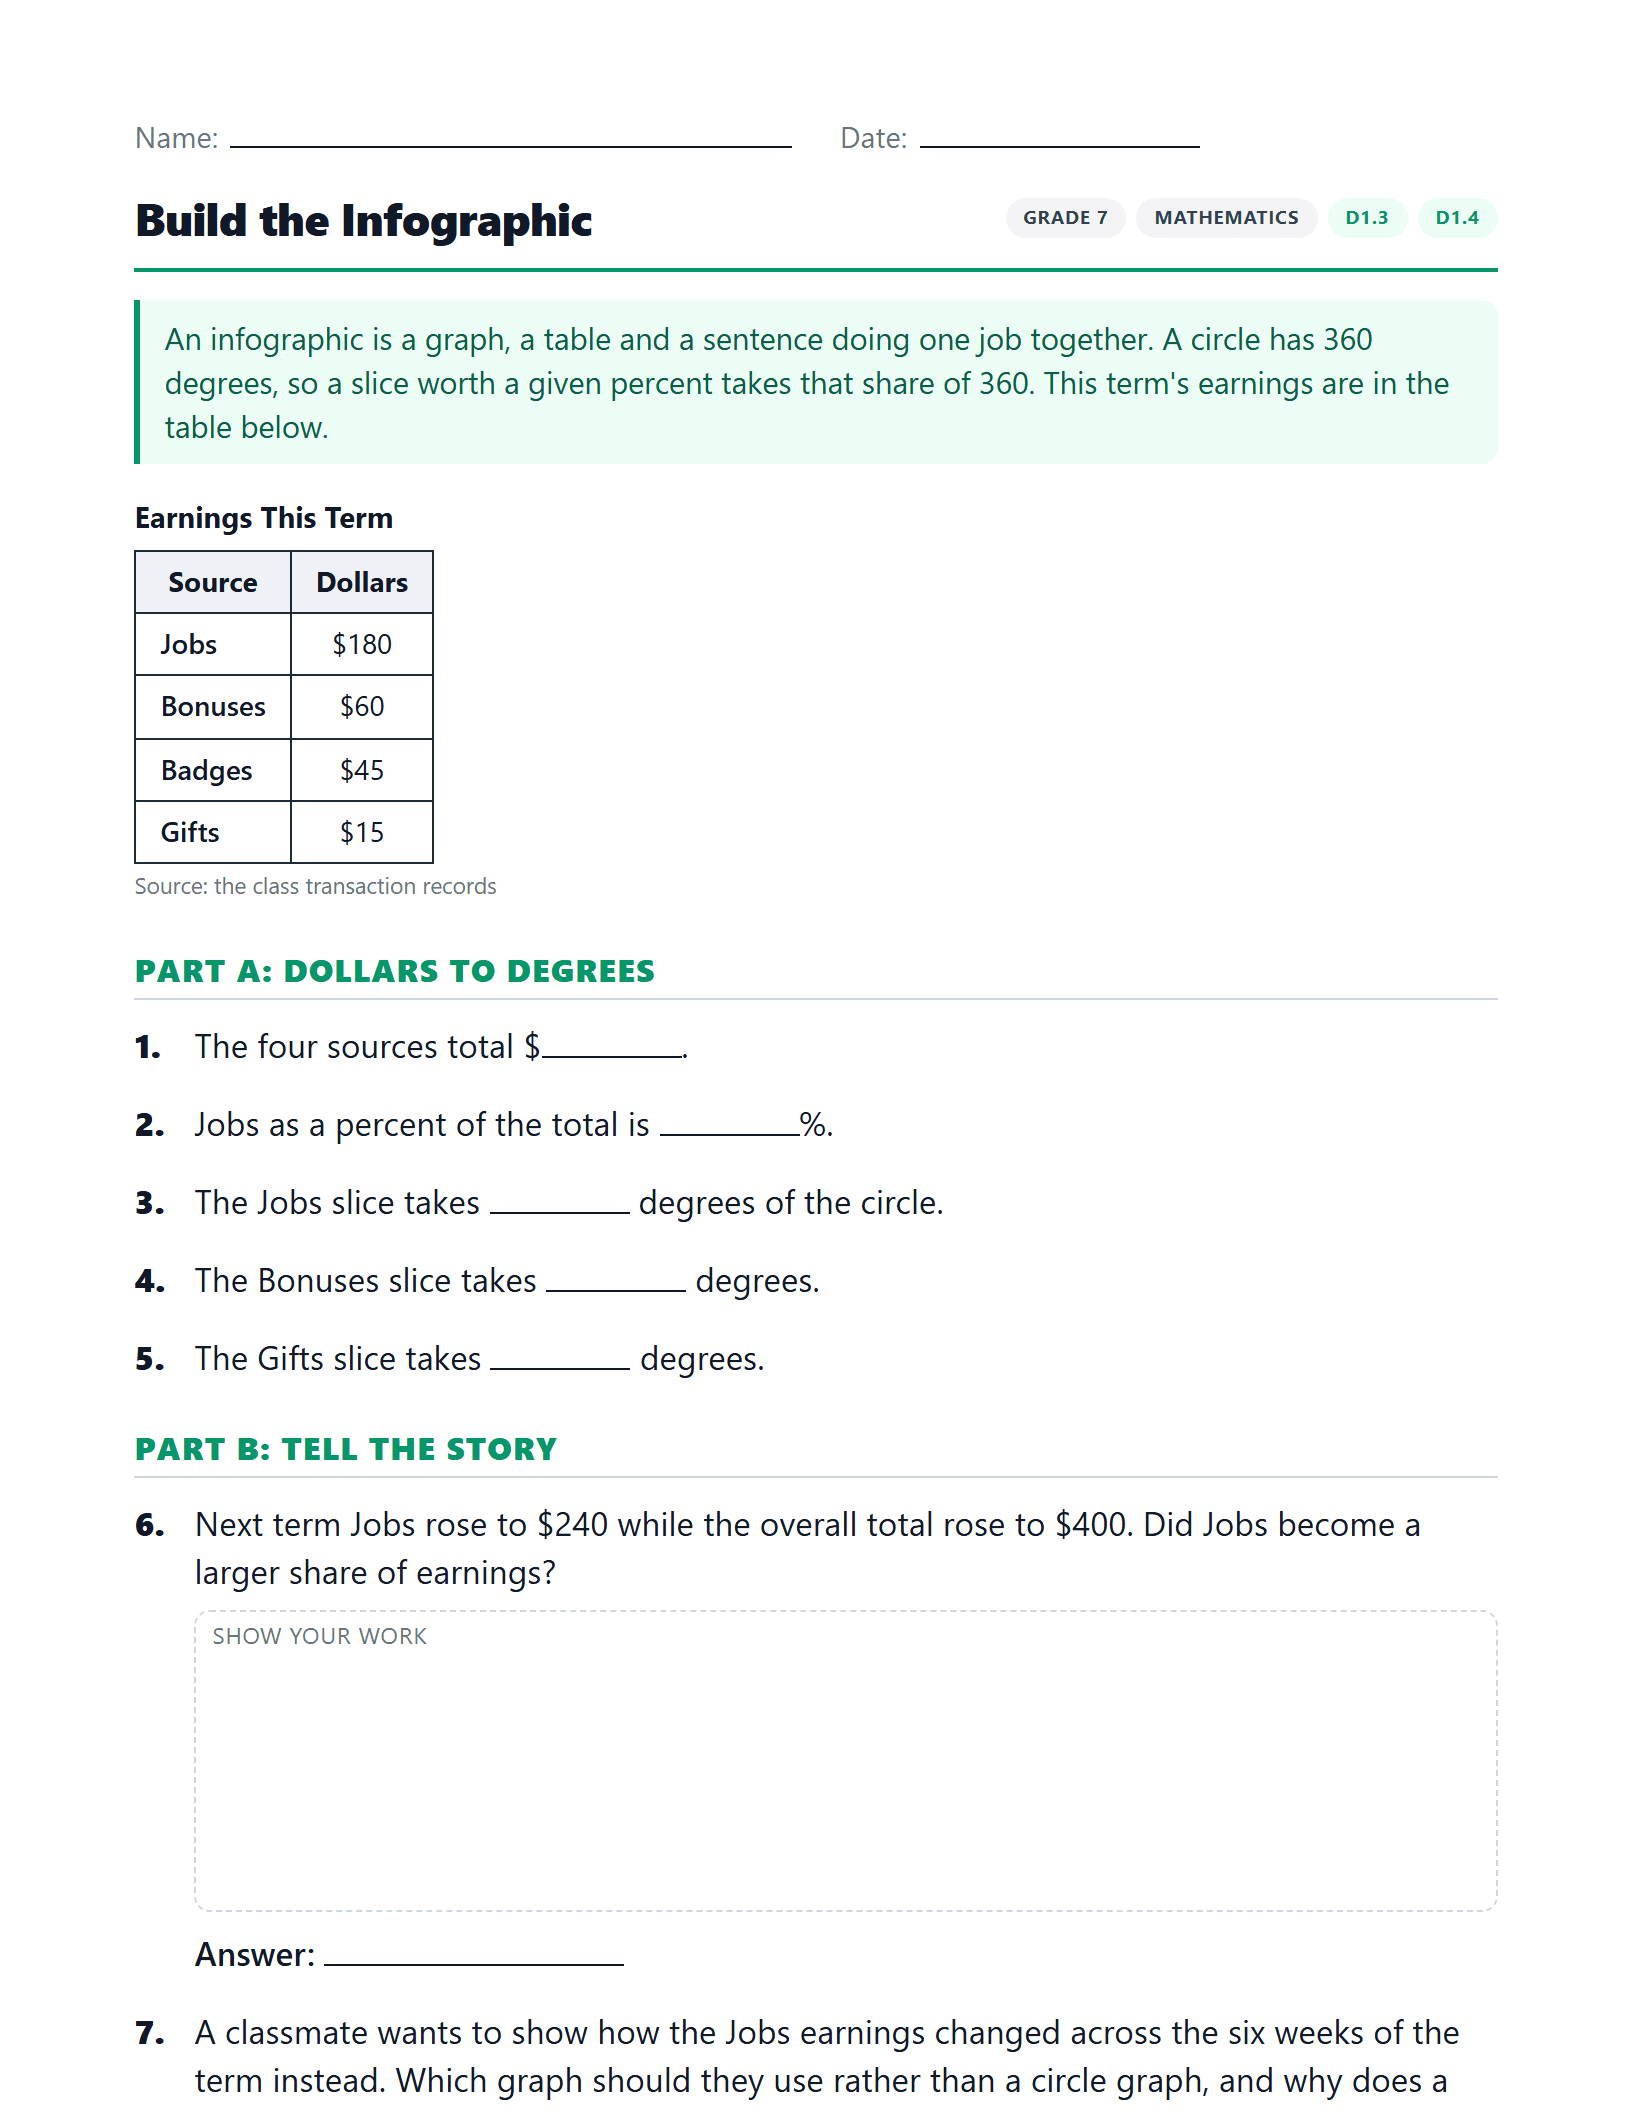
Build the Infographic
Turn raw earnings into percents and slice angles, pair the graph with a table, and say what the numbers actually claim.
B1.7
3 worksheetsConvert between fractions, decimal numbers, and percents, in various contexts
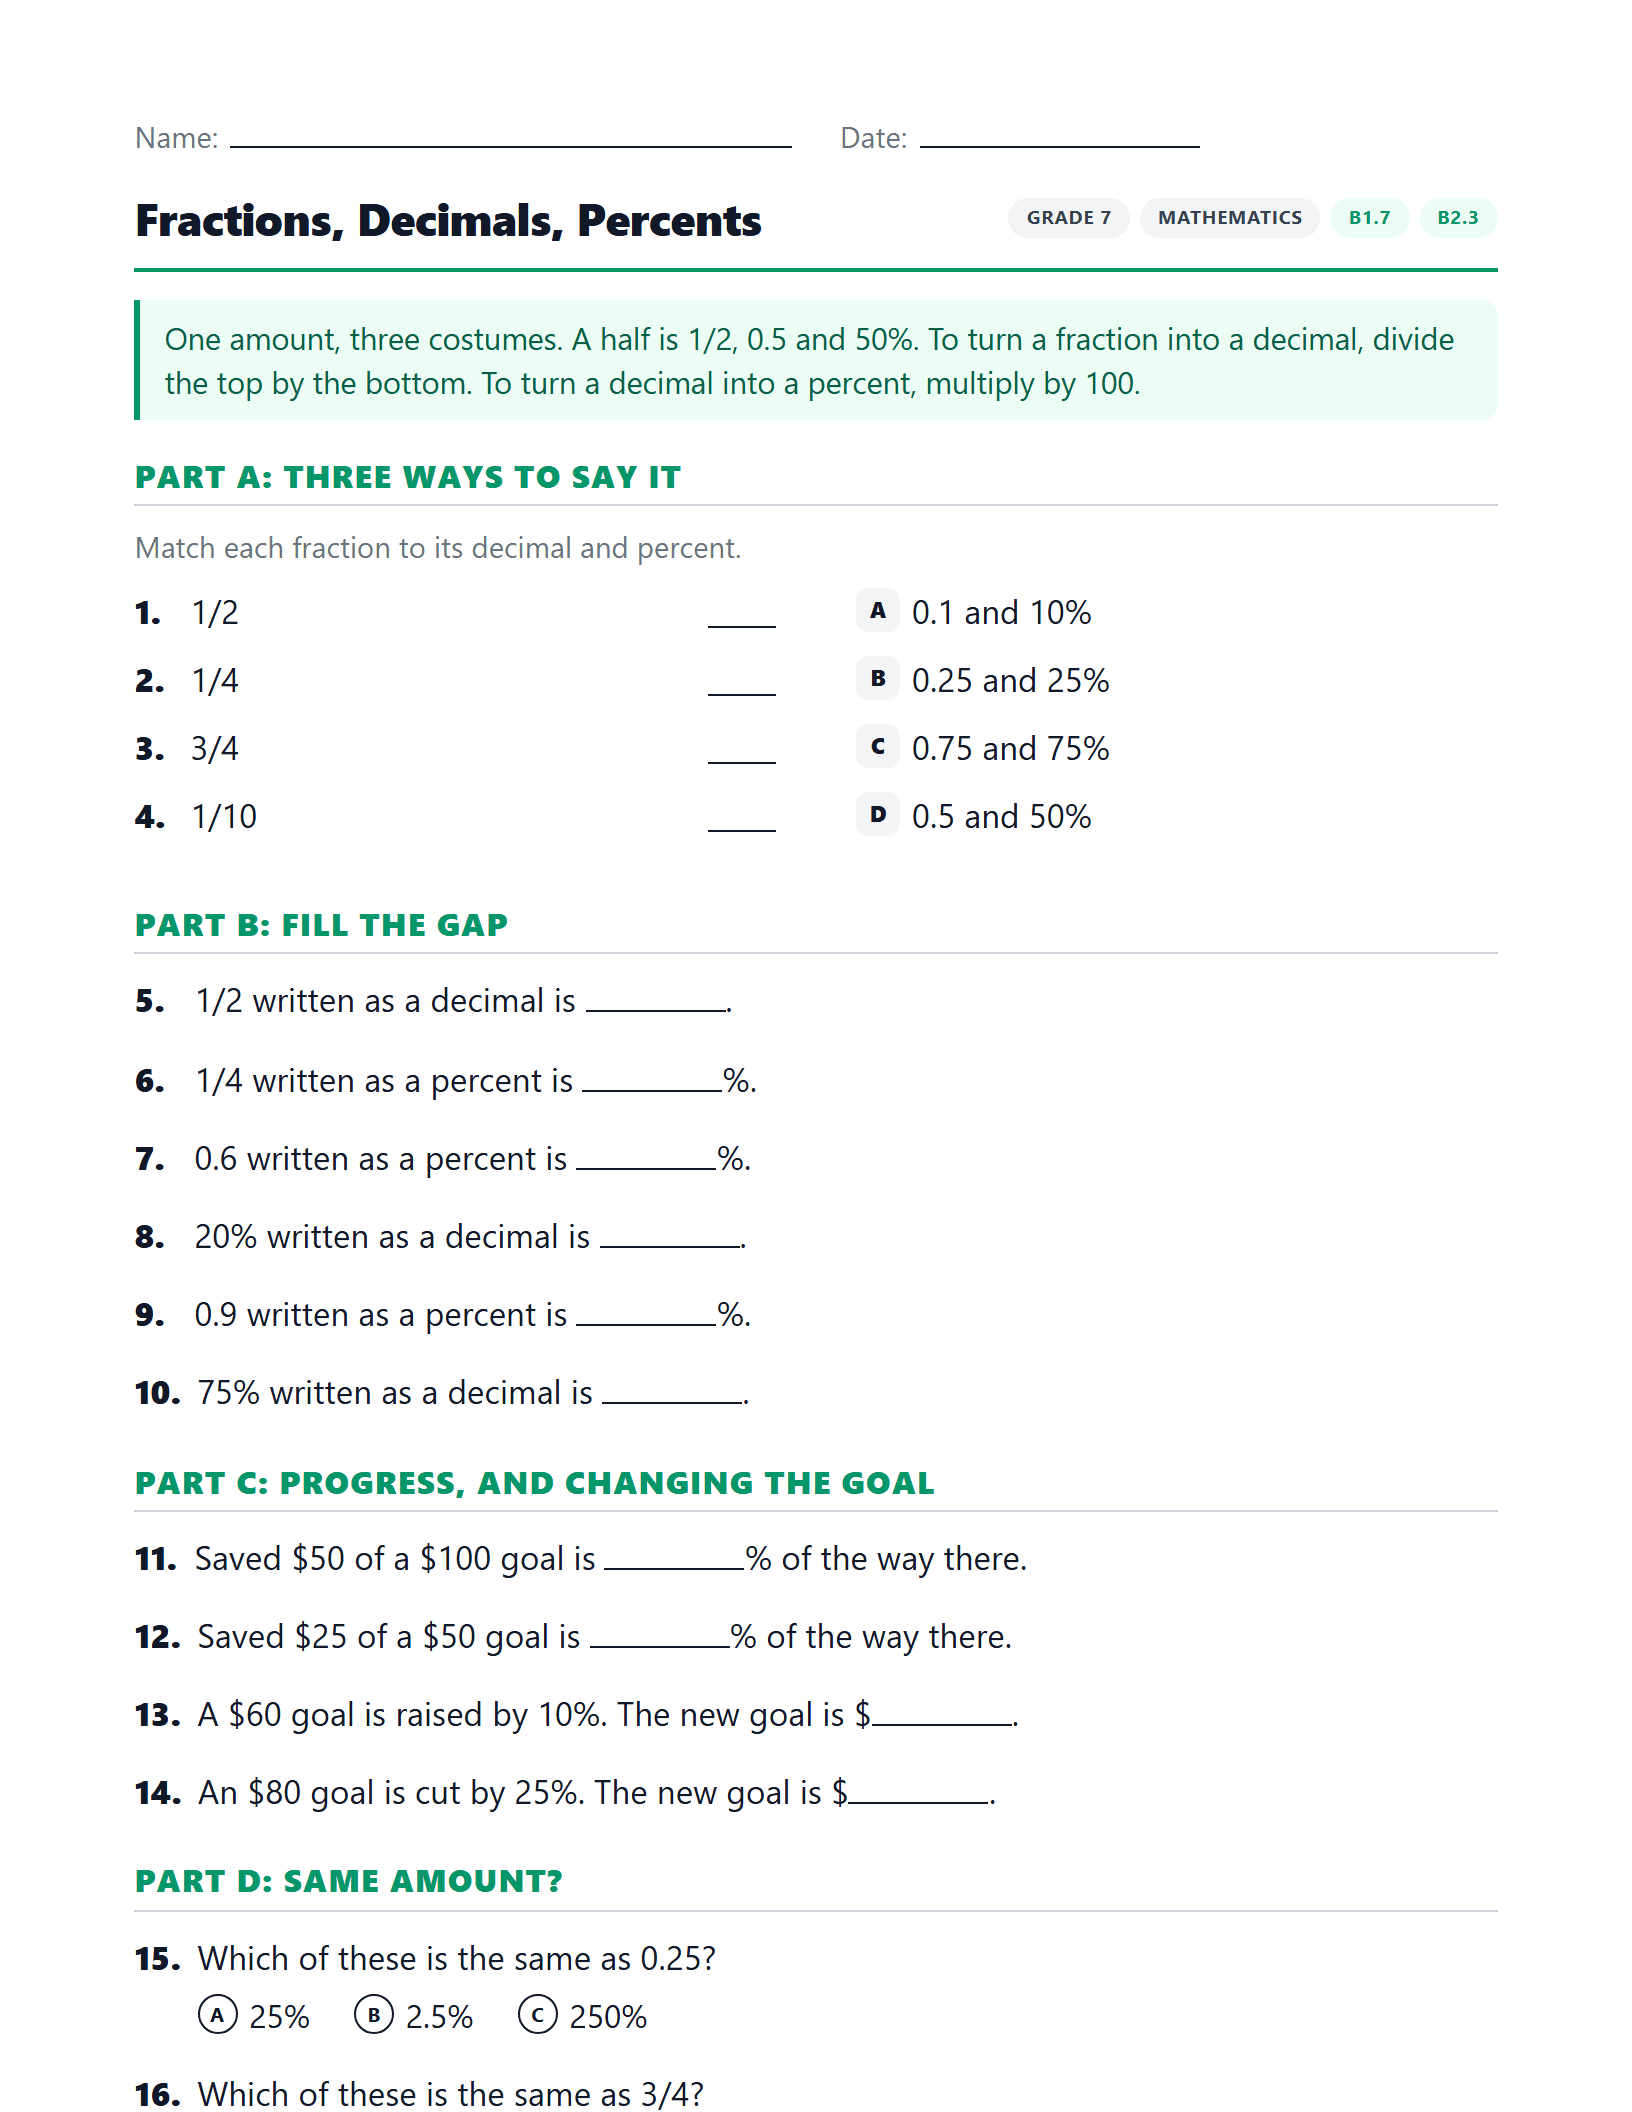
Fractions, Decimals, Percents
Move between the three ways of writing one amount, using friendly fractions and goal progress.
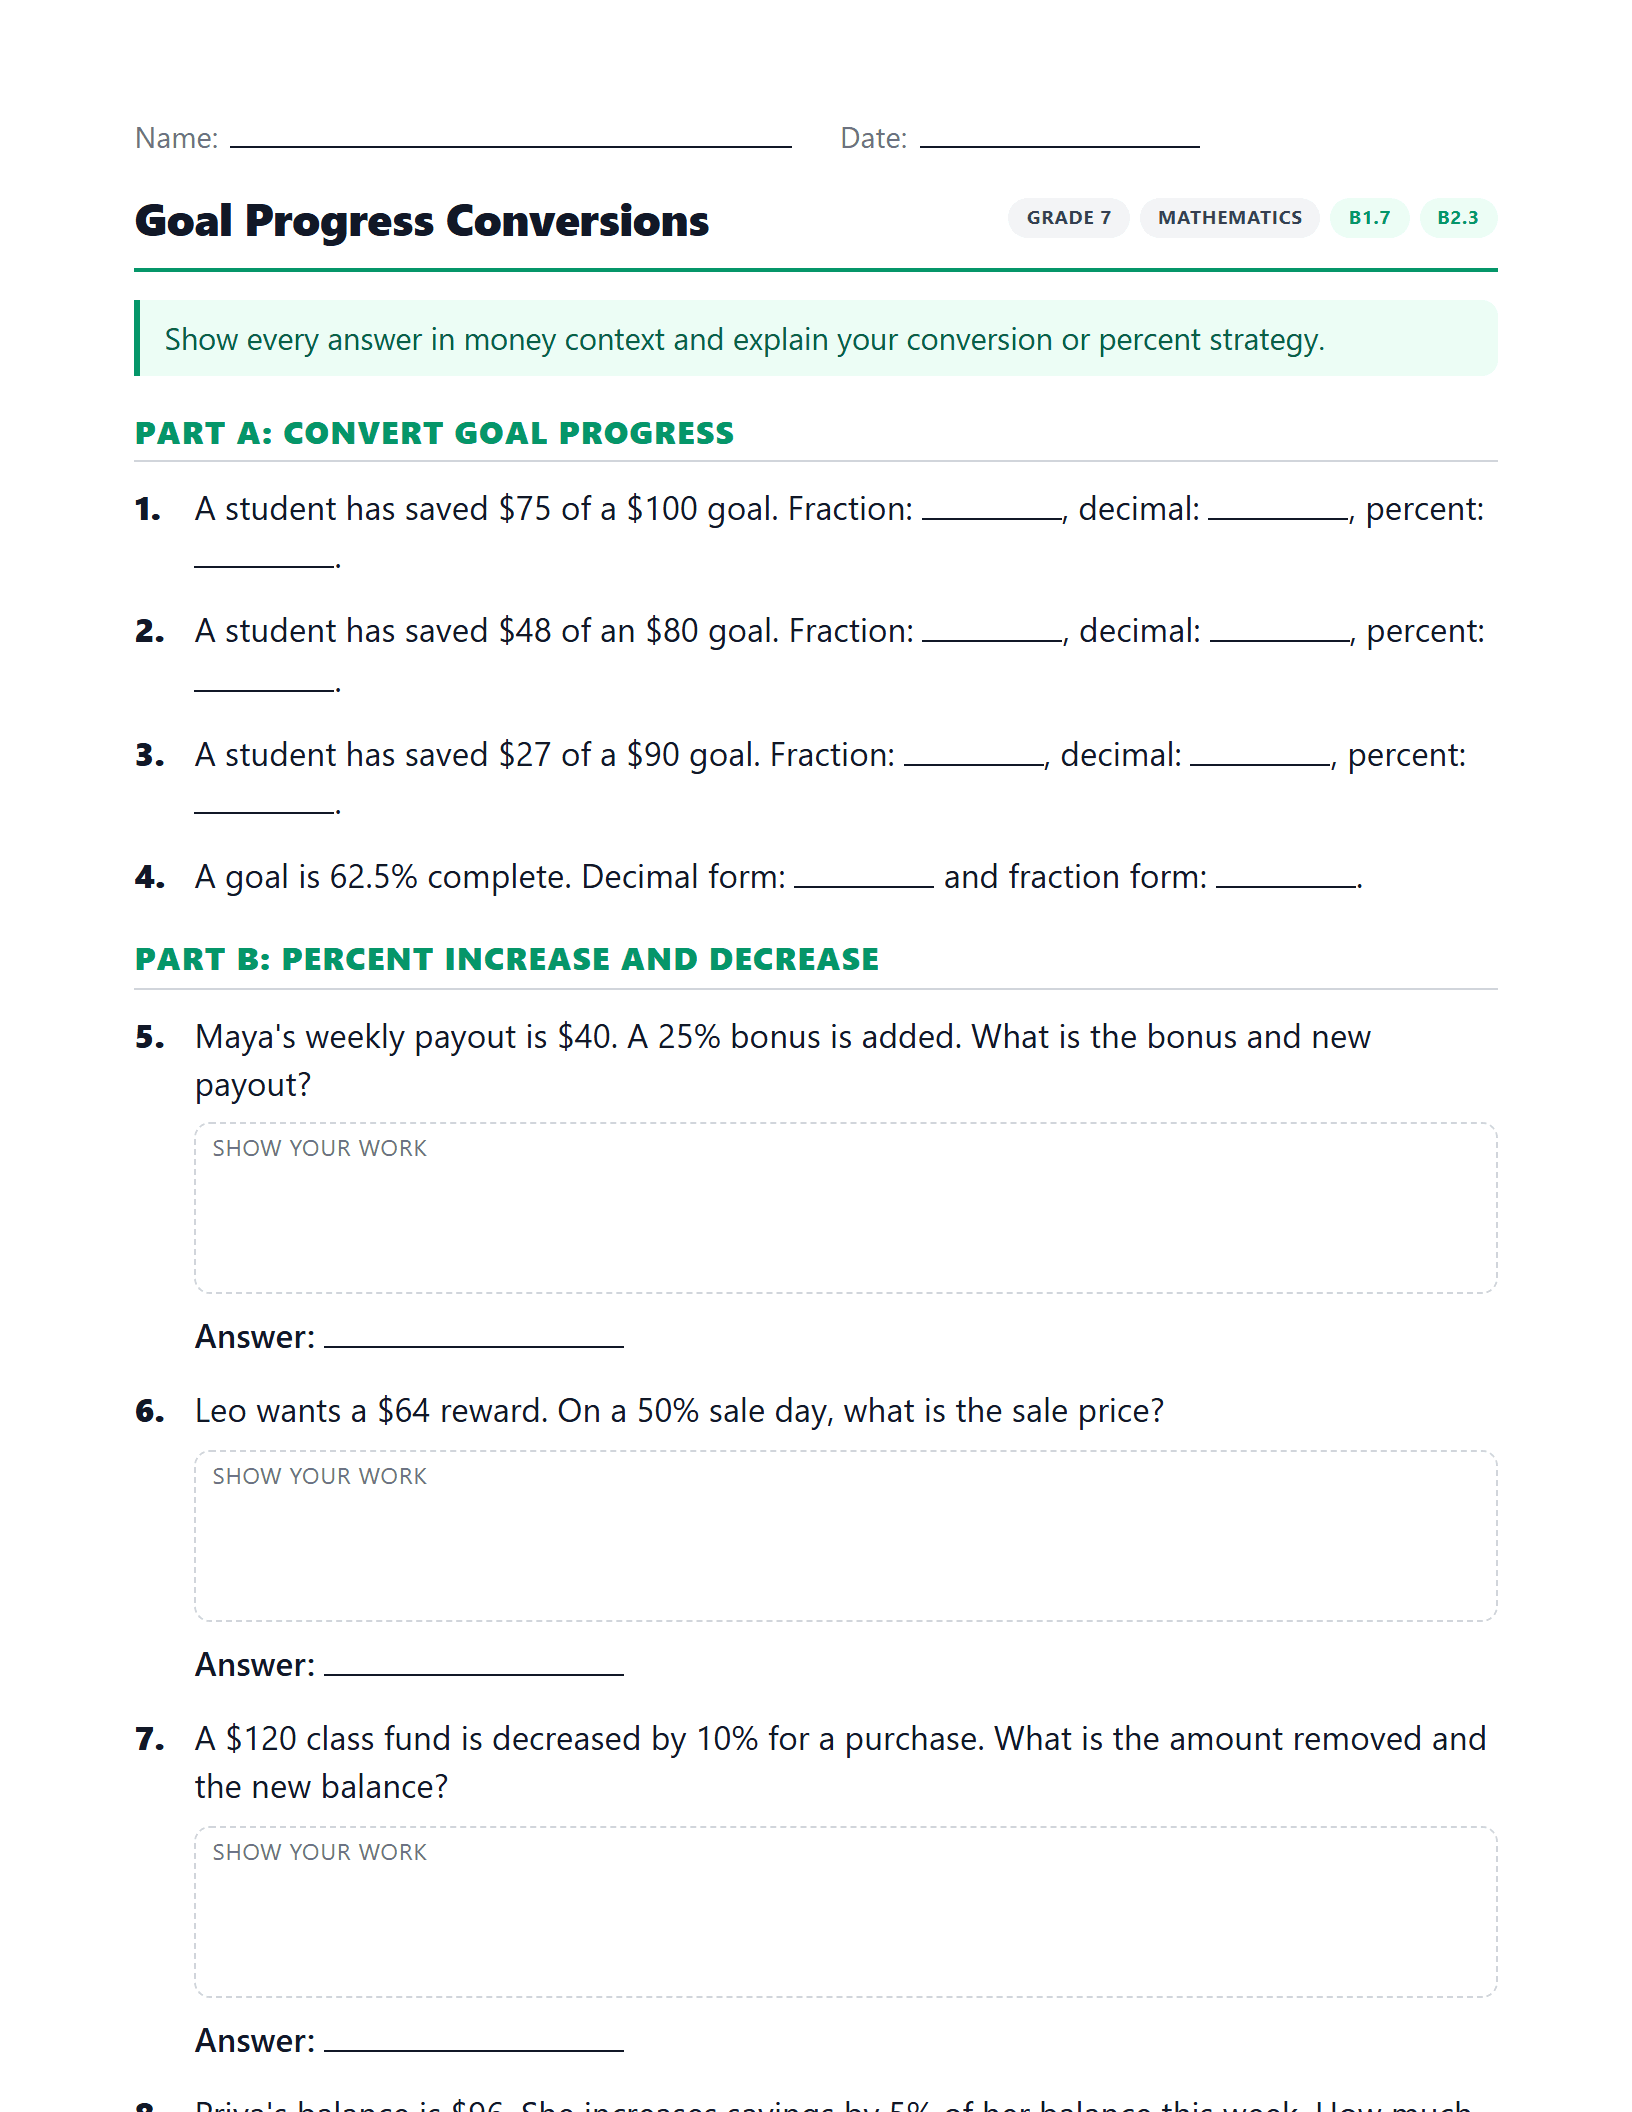
Goal Progress Conversions
Convert savings progress between fractions, decimals, and percents, then apply benchmark percent increases and decreases.
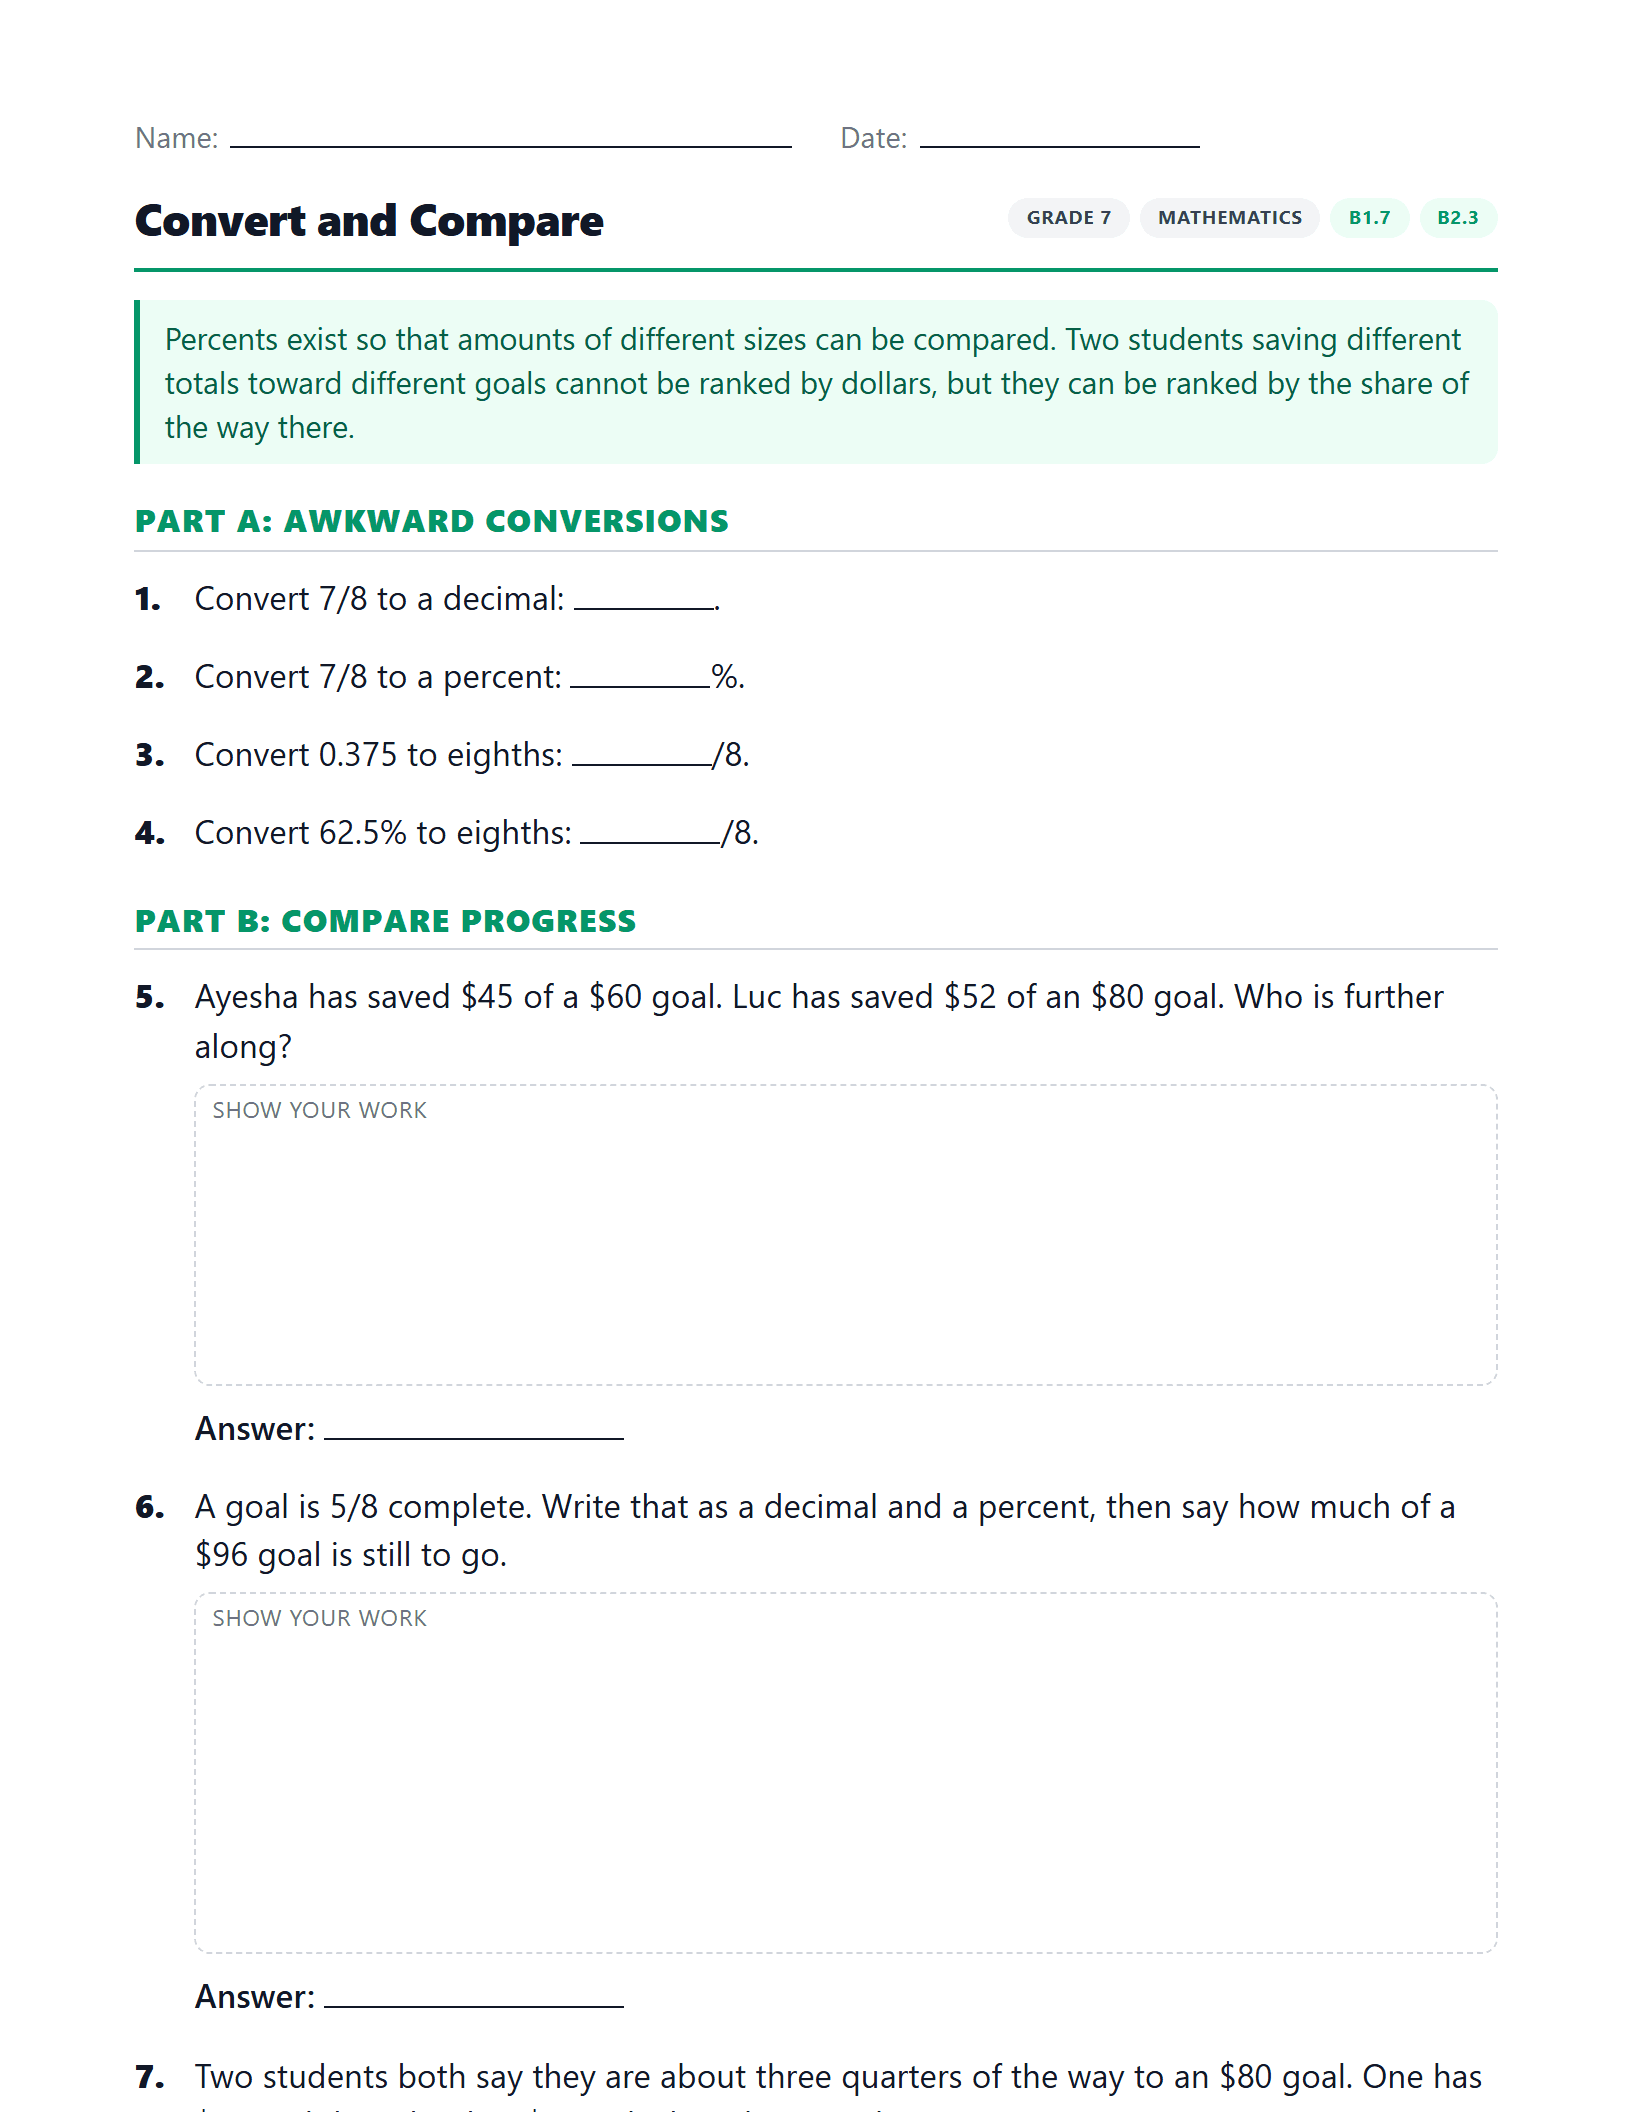
Convert and Compare
Convert awkward eighths and thirds, then use percents to compare progress on goals of different sizes.
F1.3
3 worksheetsCreate, track, and adjust sample budgets designed to meet longer-term financial goals for various scenarios
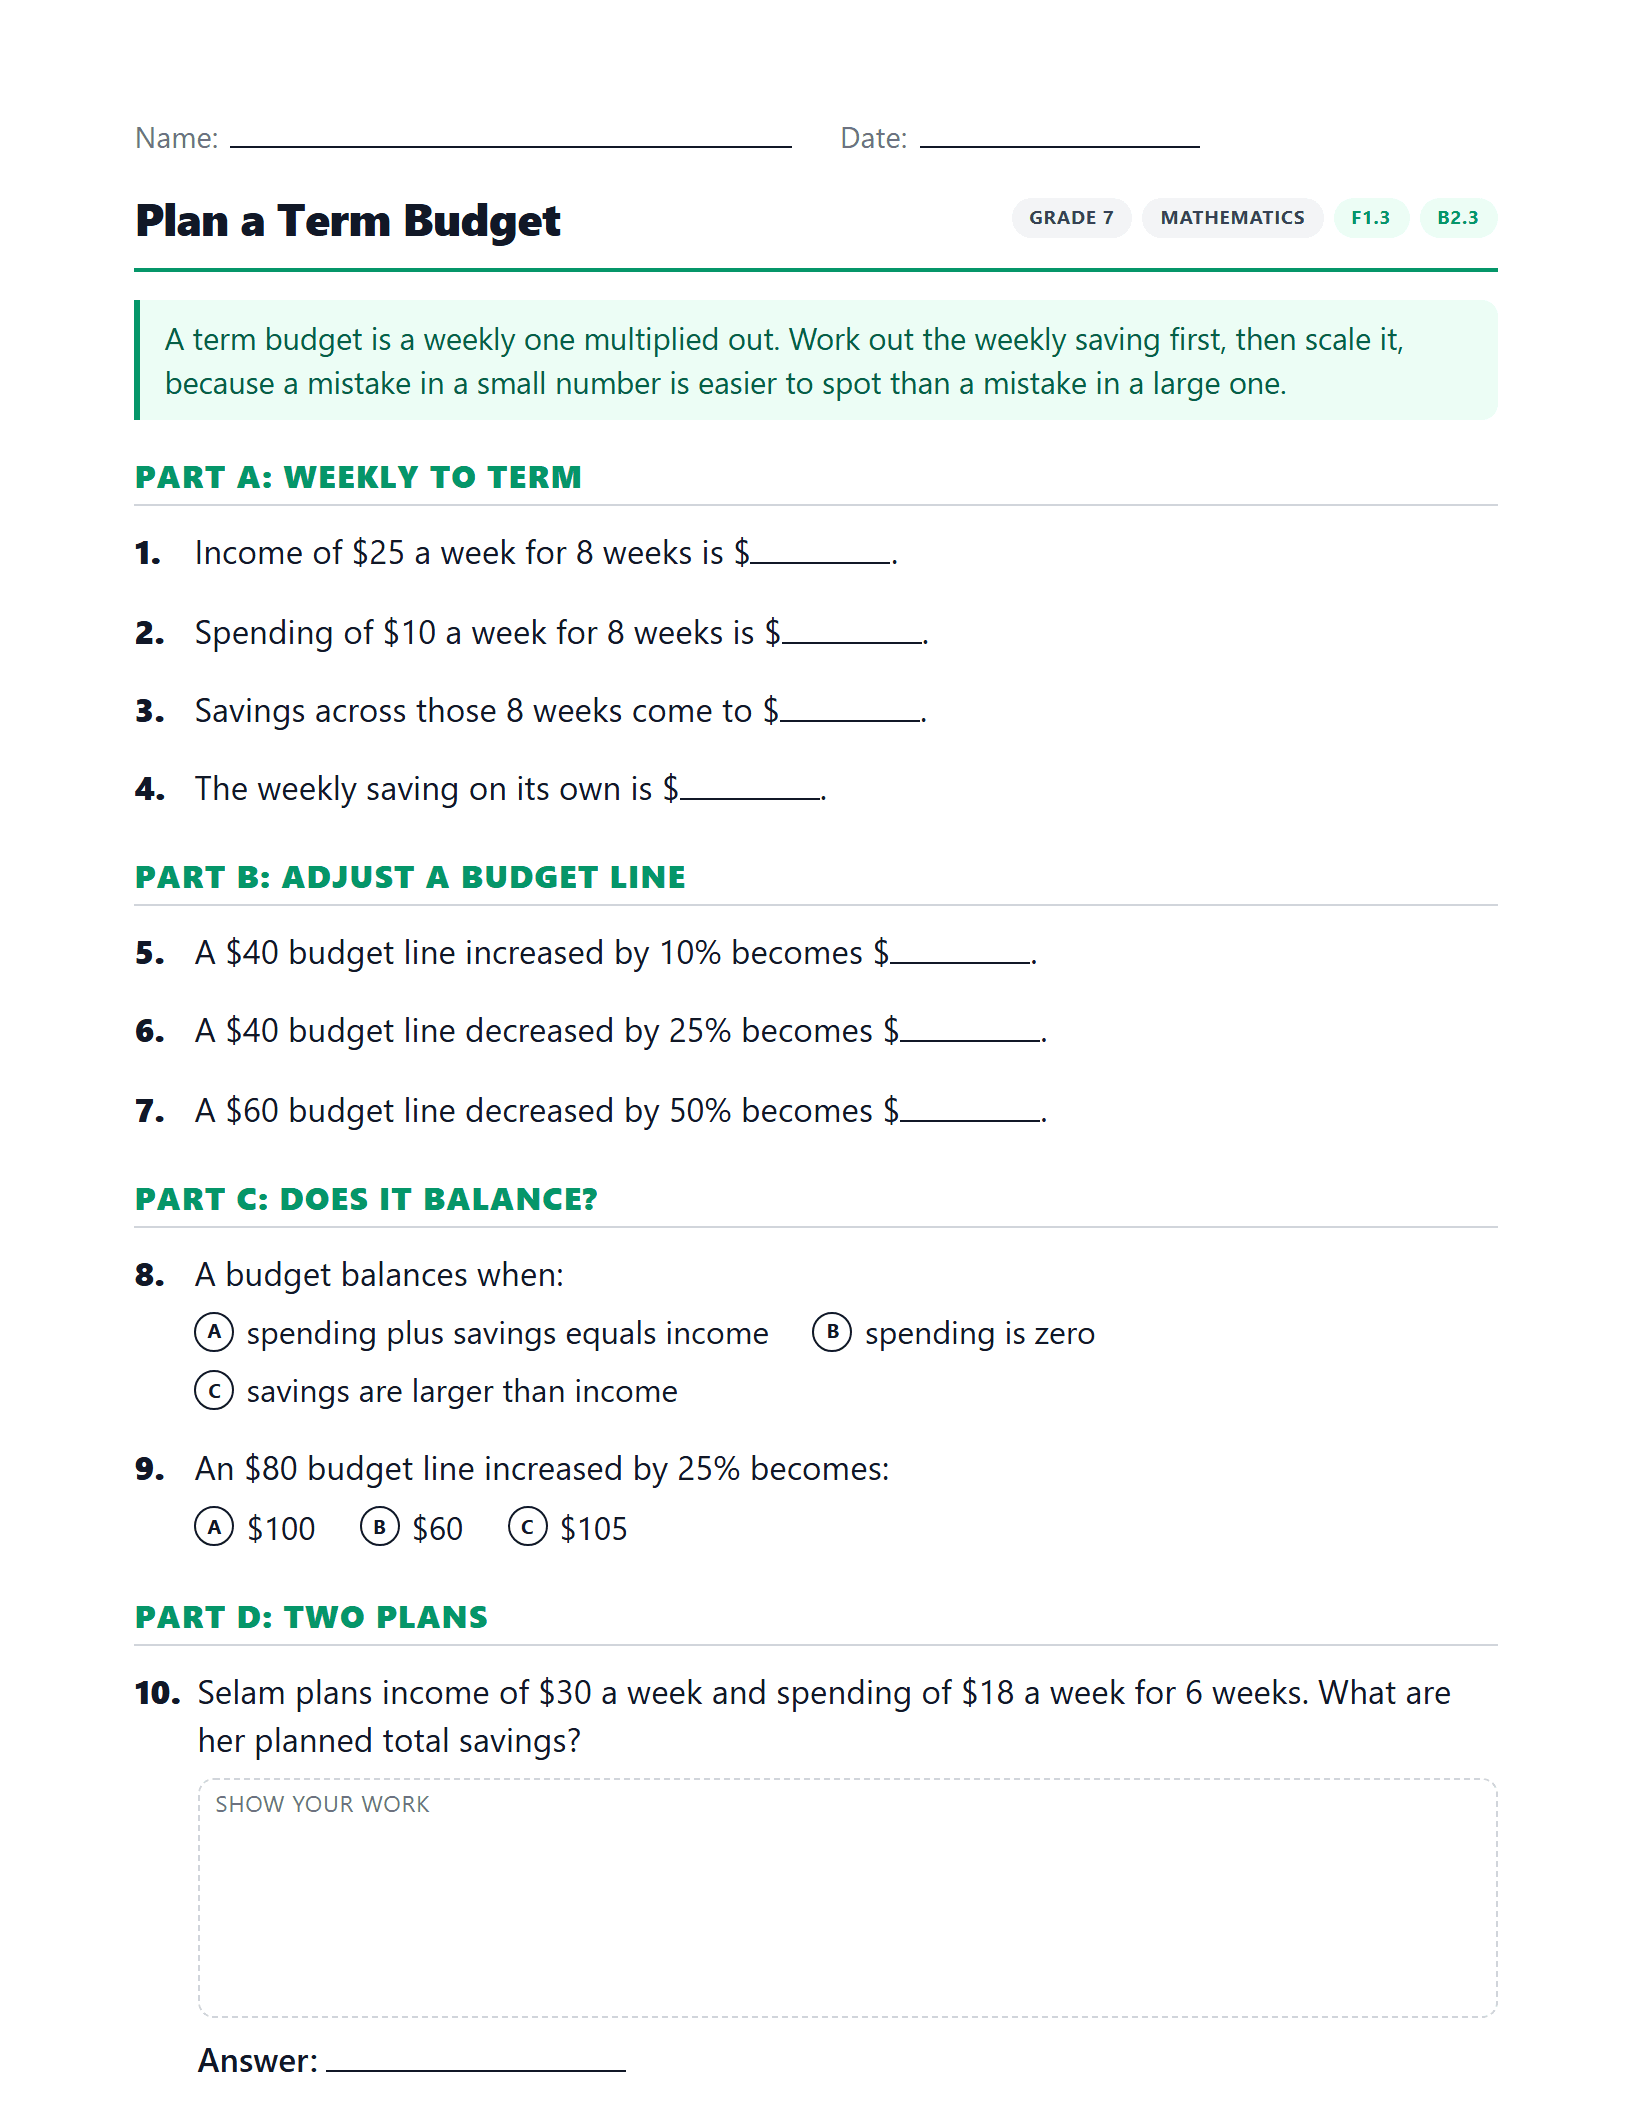
Plan a Term Budget
Scale a weekly plan up to a whole term, and adjust a budget line by a benchmark percent.
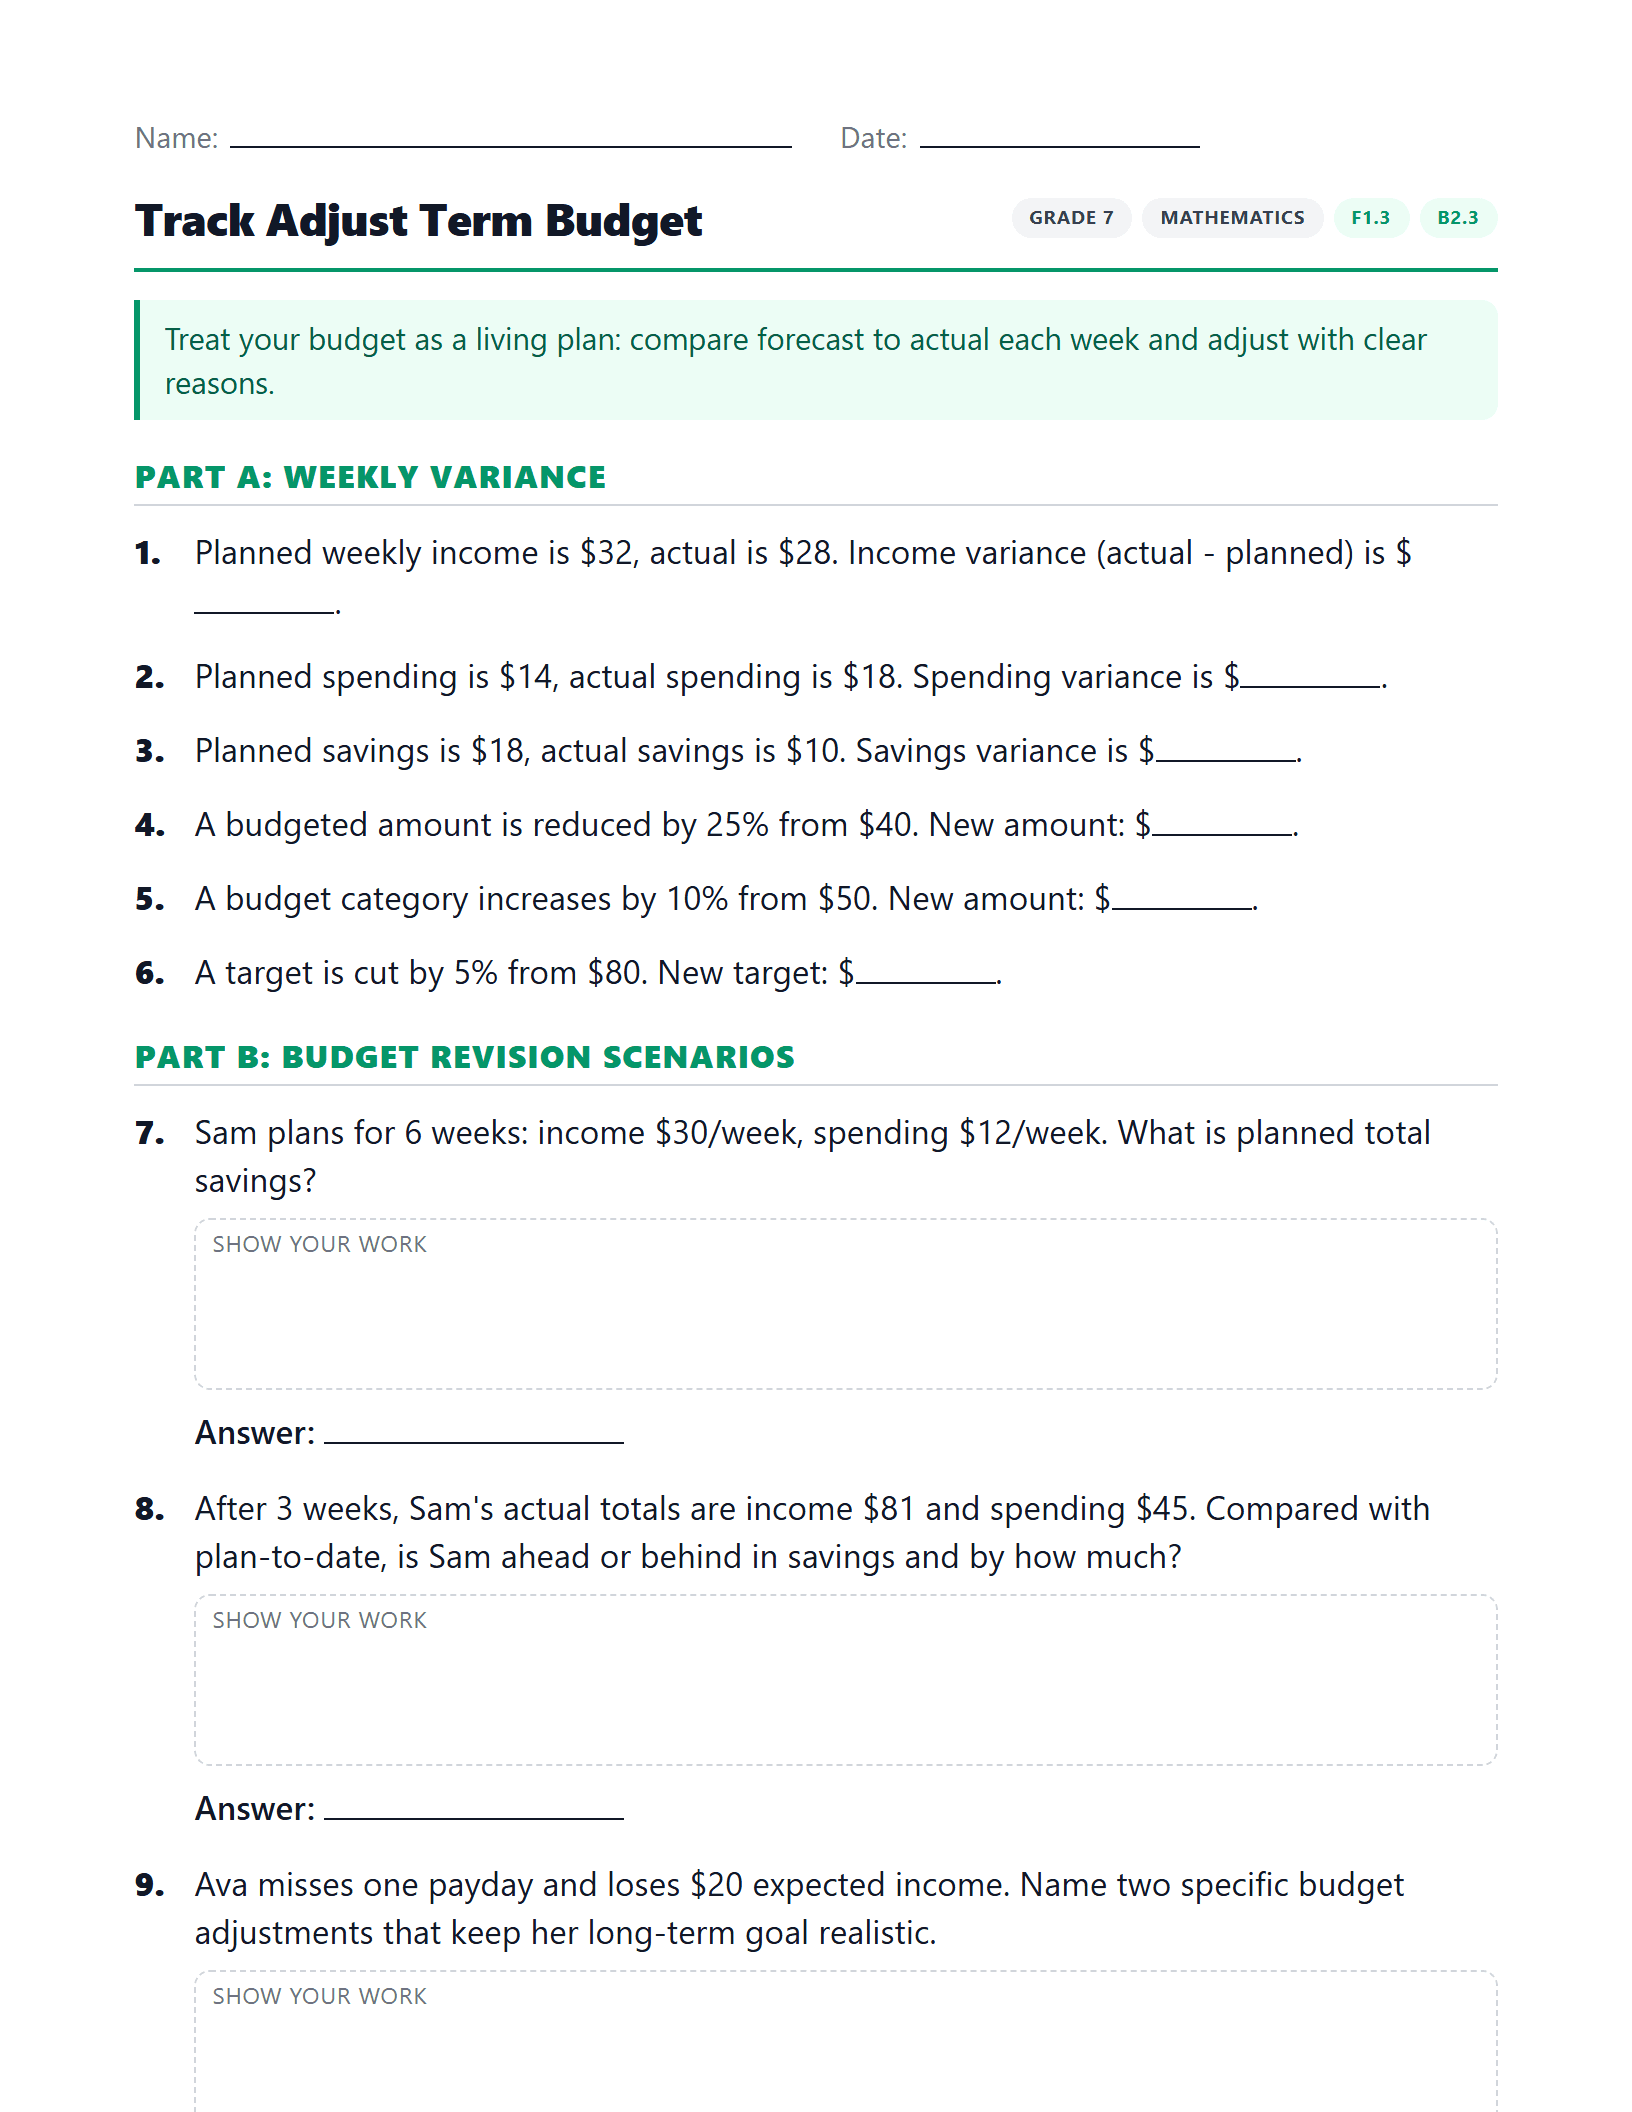
Track Adjust Term Budget
Create, track, and revise a longer-term budget using weekly variance checks and benchmark percent adjustments.
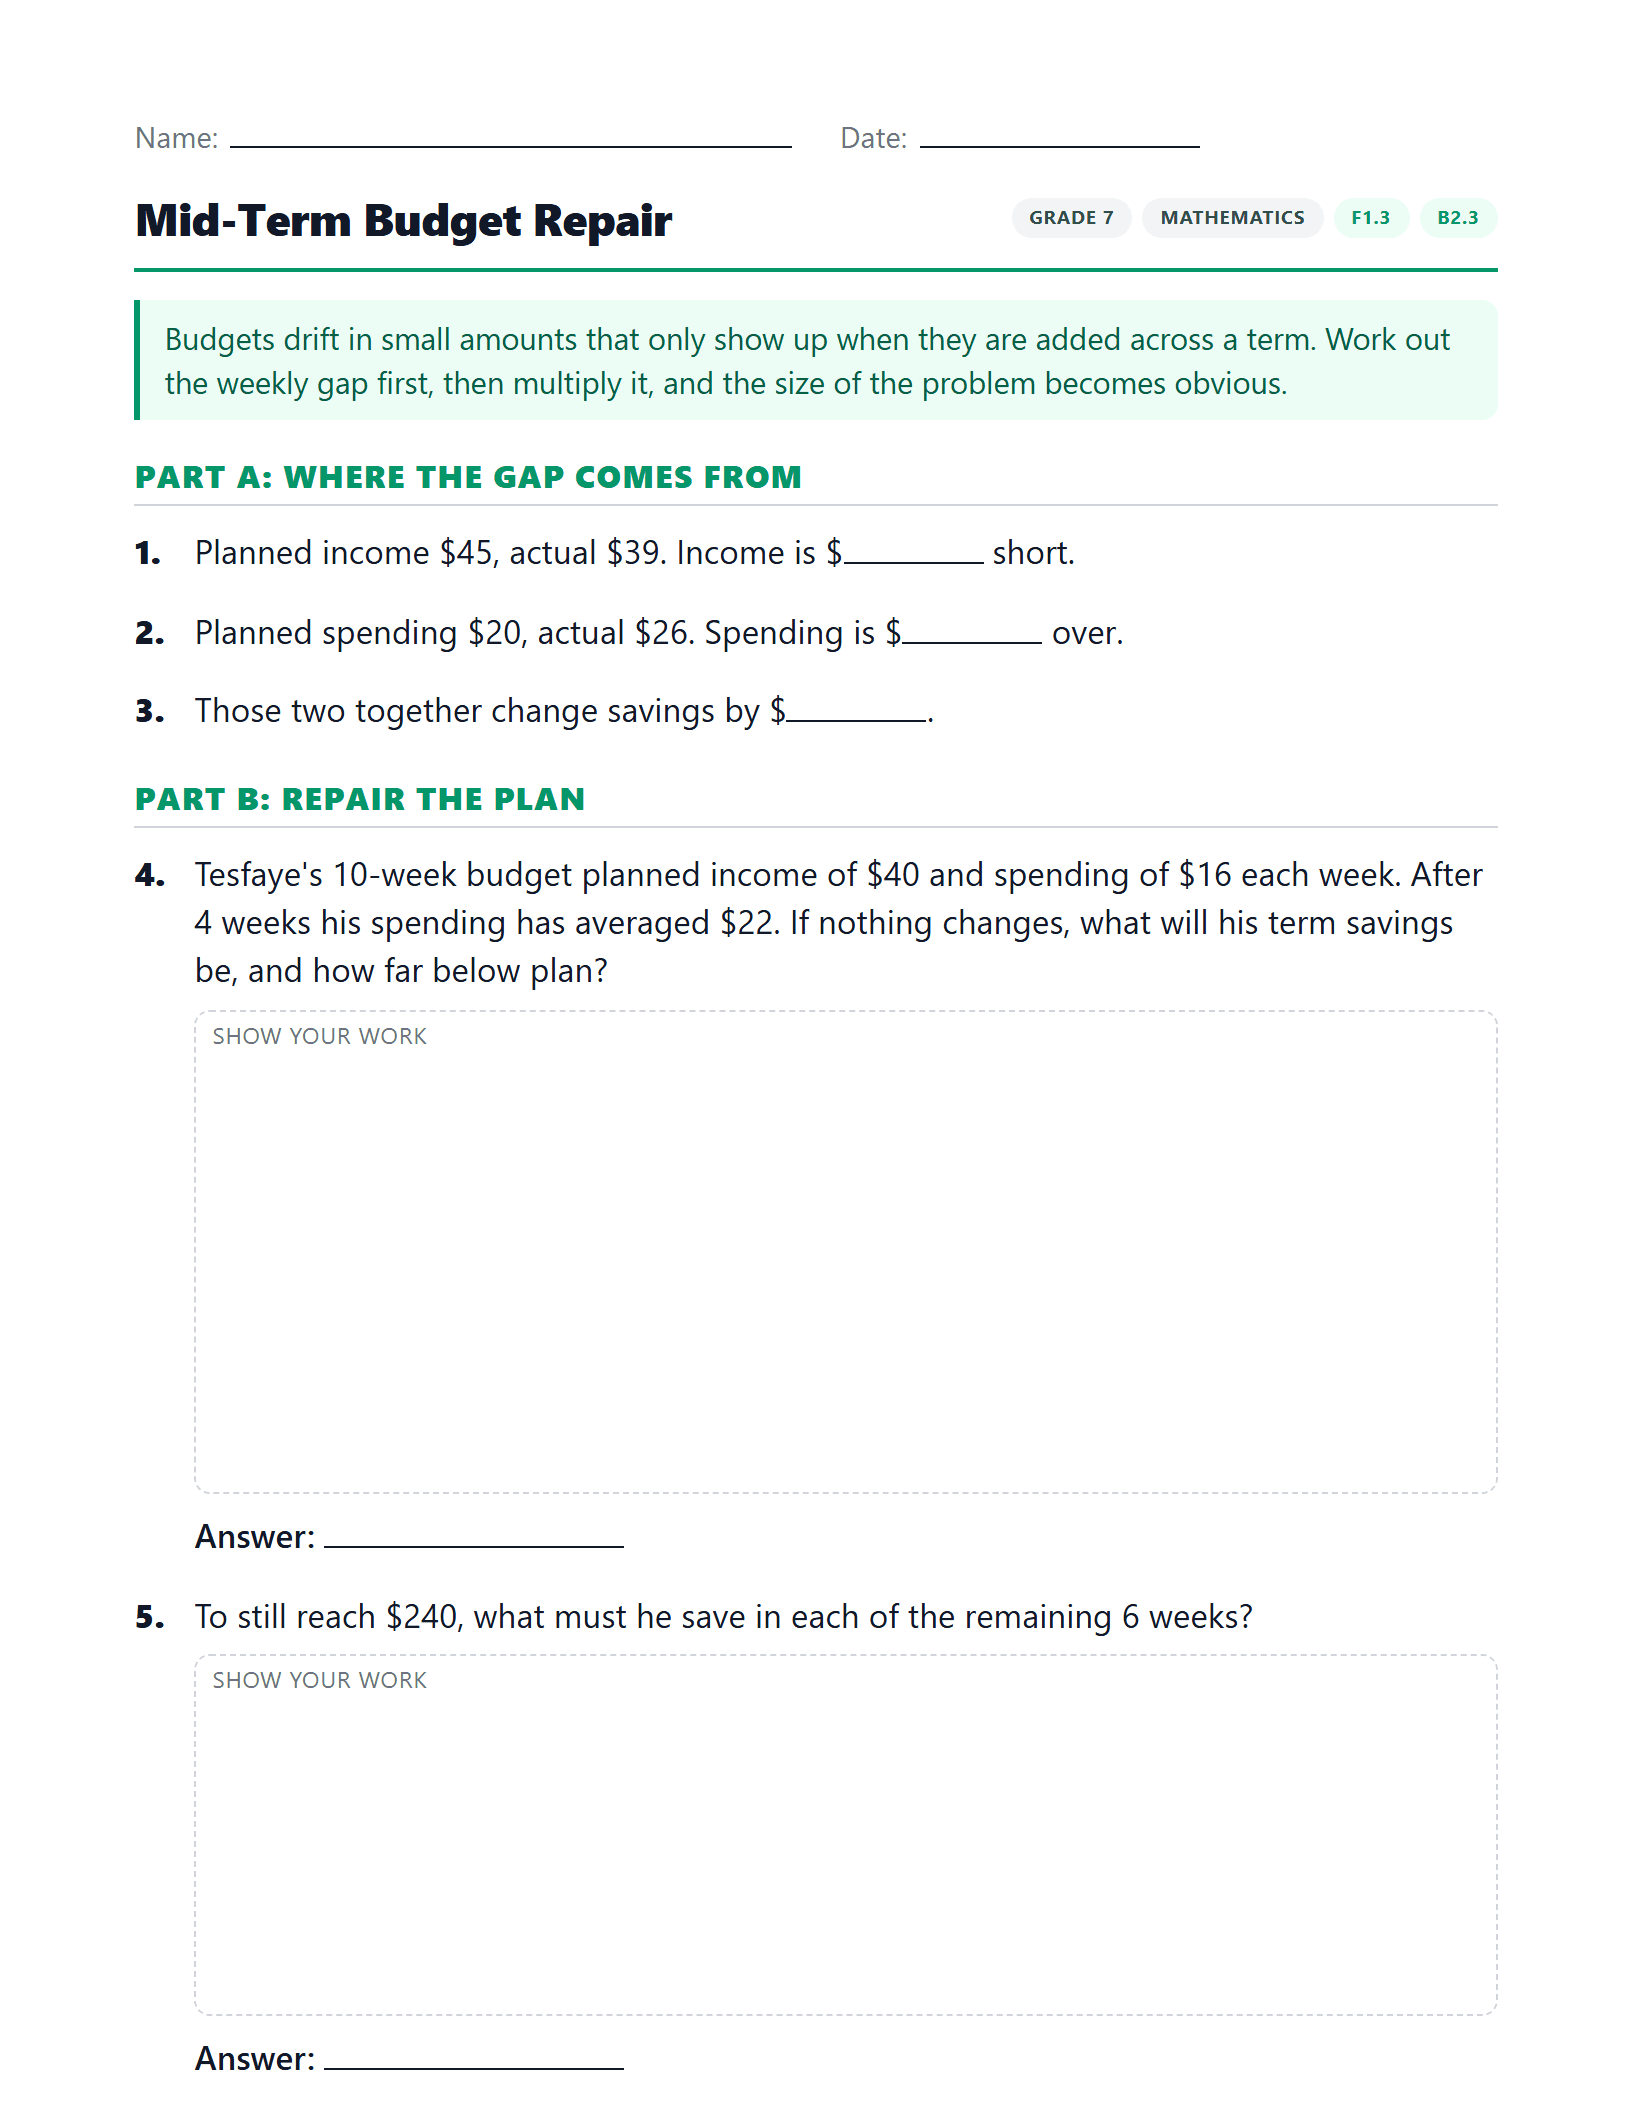
Mid-Term Budget Repair
Diagnose a budget that has drifted, cost two different repairs, and explain why a cut and a rise of the same percent do not cancel.
Want the teaching ideas behind these sheets?
See how each Grade 7 expectation connects to your classroom economy, with activity ideas for every one.